Preventive Care Gaps in Medicaid Populations
Medicaid's sickest patients skip free preventive care, driving costs upward.

Medicaid enrollees are not a uniform bloc of people who simply lack income. They are a clinically complex population, and that complexity is the necessary starting point, not an asterisk.
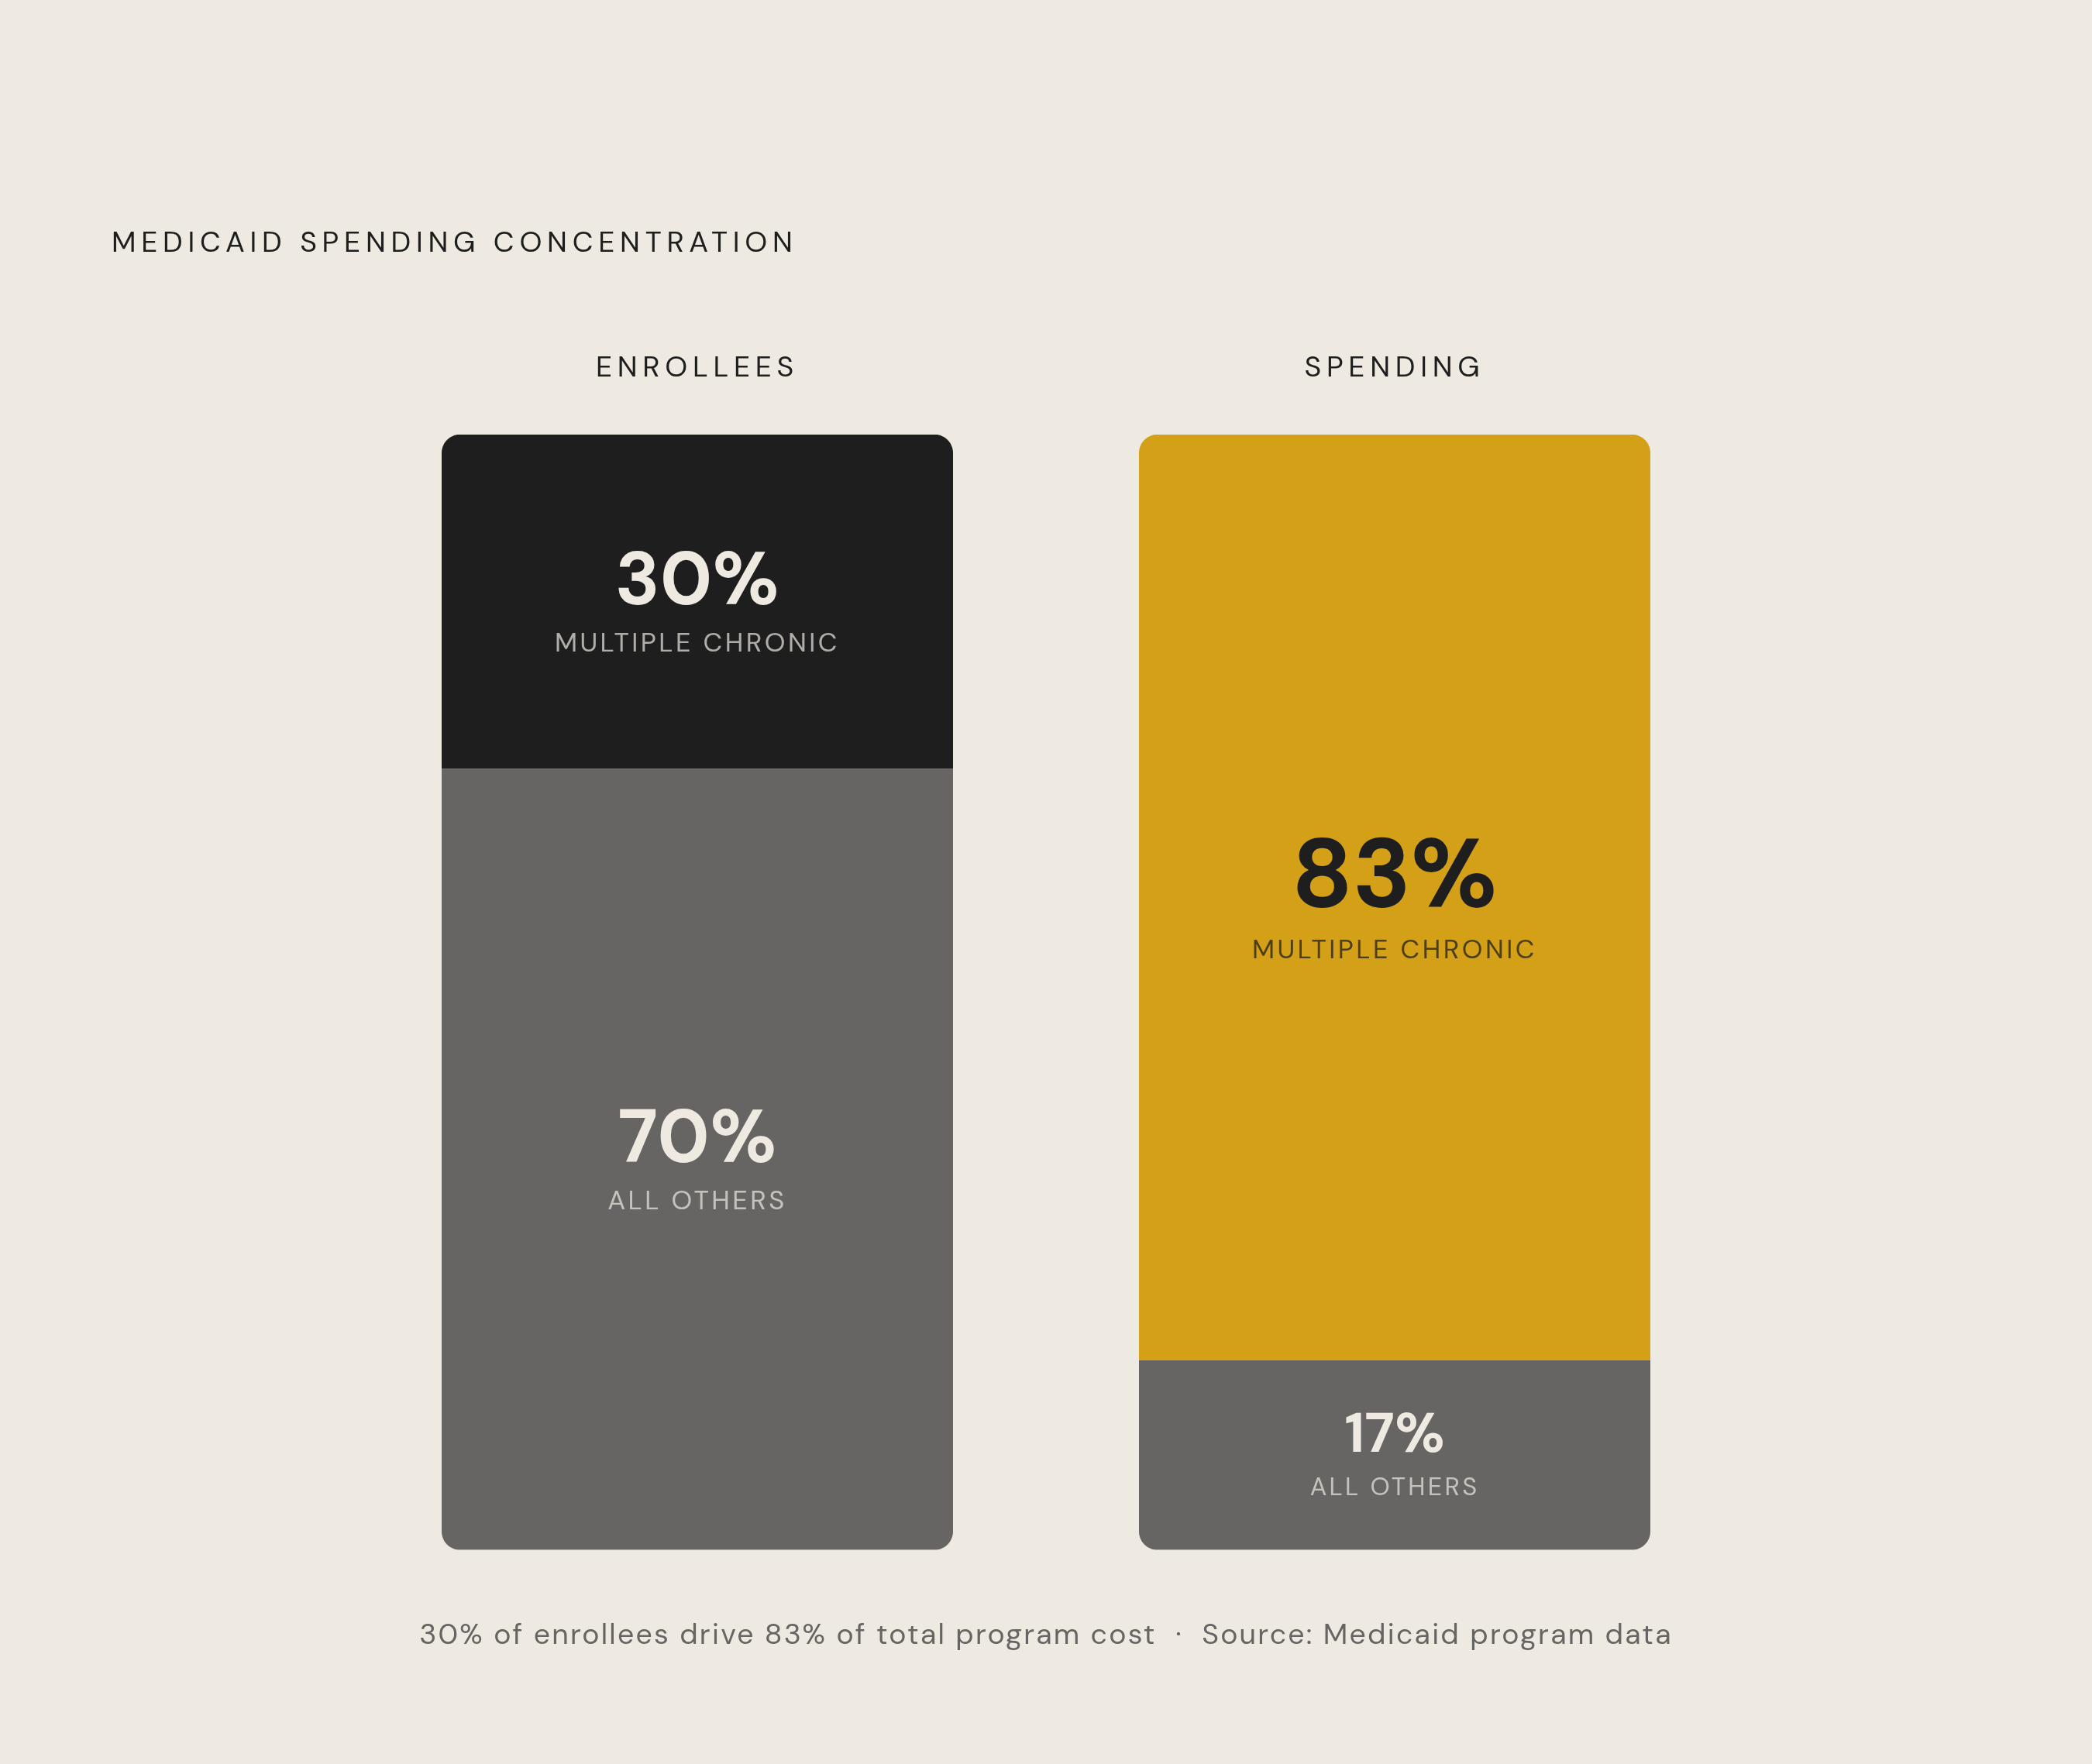
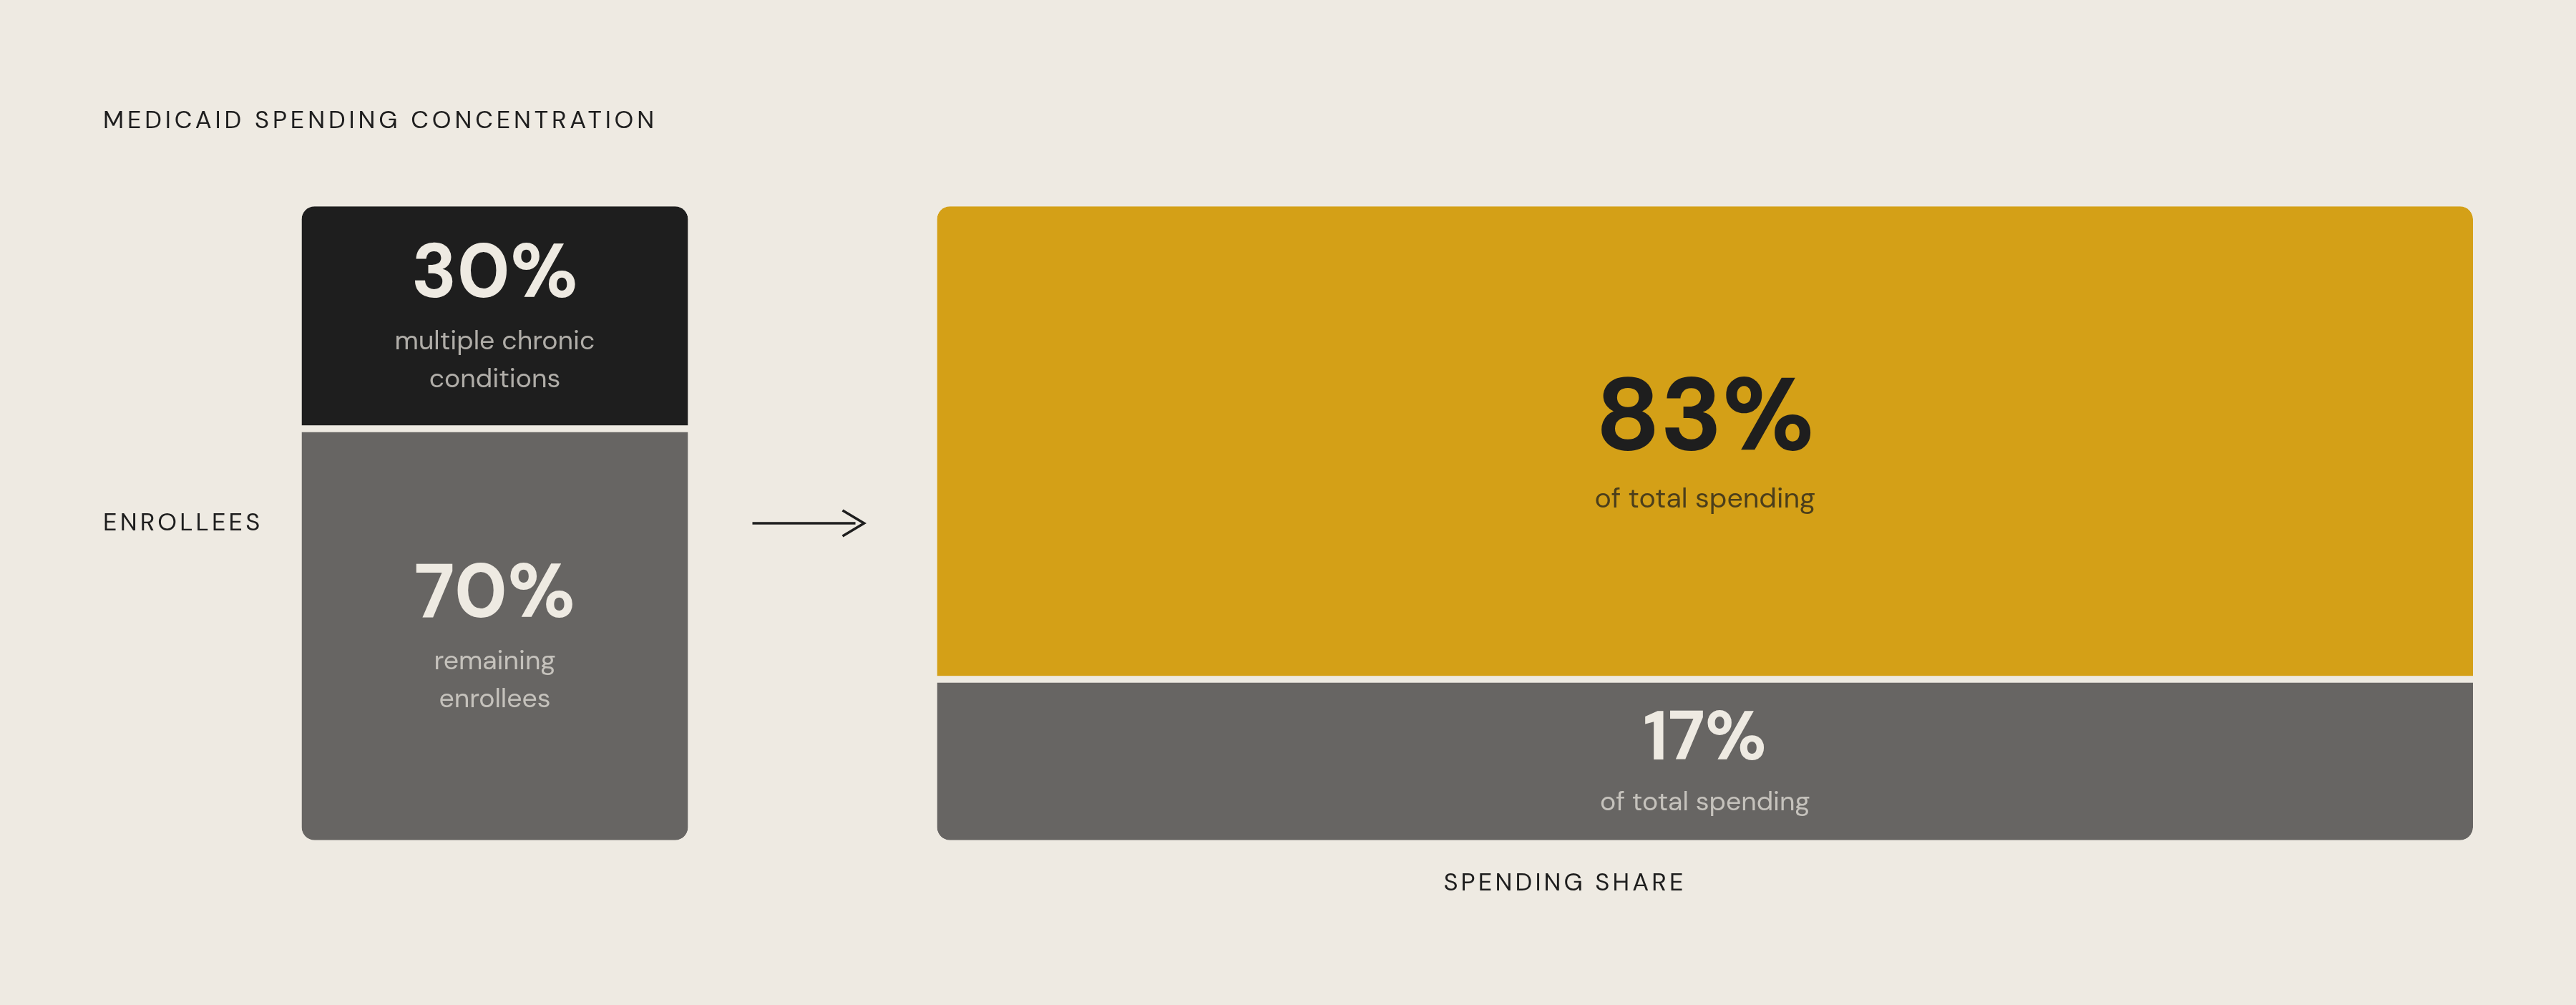
Nearly 30 percent of non-elderly adult Medicaid beneficiaries report being in only fair or poor health, roughly double the rate among low-income adults with private insurance. One in ten adult enrollees carries a diagnosed mental illness. Seven in ten are overweight or obese. Close to one in three smoke tobacco. Thirty percent of beneficiaries have multiple chronic conditions, and that subset accounts for 83 percent of total program spending.
That last figure is the one that stopped me when I first encountered it. Spend enough time inside Medicaid policy and you notice how rarely the program gets treated as a prevention problem rather than a cost problem, even though the arithmetic points in only one direction. The population most likely to benefit from early intervention is, by every available measure, the least likely to receive it. When chronic conditions go unscreened, they compound in predictable sequence: a missed hypertension check becomes an unmanaged cardiovascular event; a skipped glucose screening becomes an undiagnosed diabetic who surfaces in the acute care system mid-crisis. The fiscal case for preventive care is not subtle. The program has found ways to ignore it anyway, which is the more interesting question.
Preventive care is not a supplemental amenity in this context. It is the mechanism by which expensive, catastrophic downstream utilization might reasonably be avoided.
What Medicaid Technically Covers and Where Coverage Ends
Medicaid's mandatory benefit package is substantive, which makes the utilization gap more puzzling, not less. Physician services, outpatient hospital care, laboratory and diagnostic imaging, federally qualified health center services, family planning, and the Early and Periodic Screening, Diagnostic and Treatment program for children are all required. Preventive services are available at no cost-sharing. On paper, the program is more generous than many private plans.
Optional benefits vary considerably by state. Adult dental coverage, prescription drugs beyond narrow formularies, and home and community-based services can be included or excluded at state discretion. Dental access is particularly inconsistent in ways that carry real clinical consequences, given the well-established connections between oral health and cardiovascular and metabolic disease.
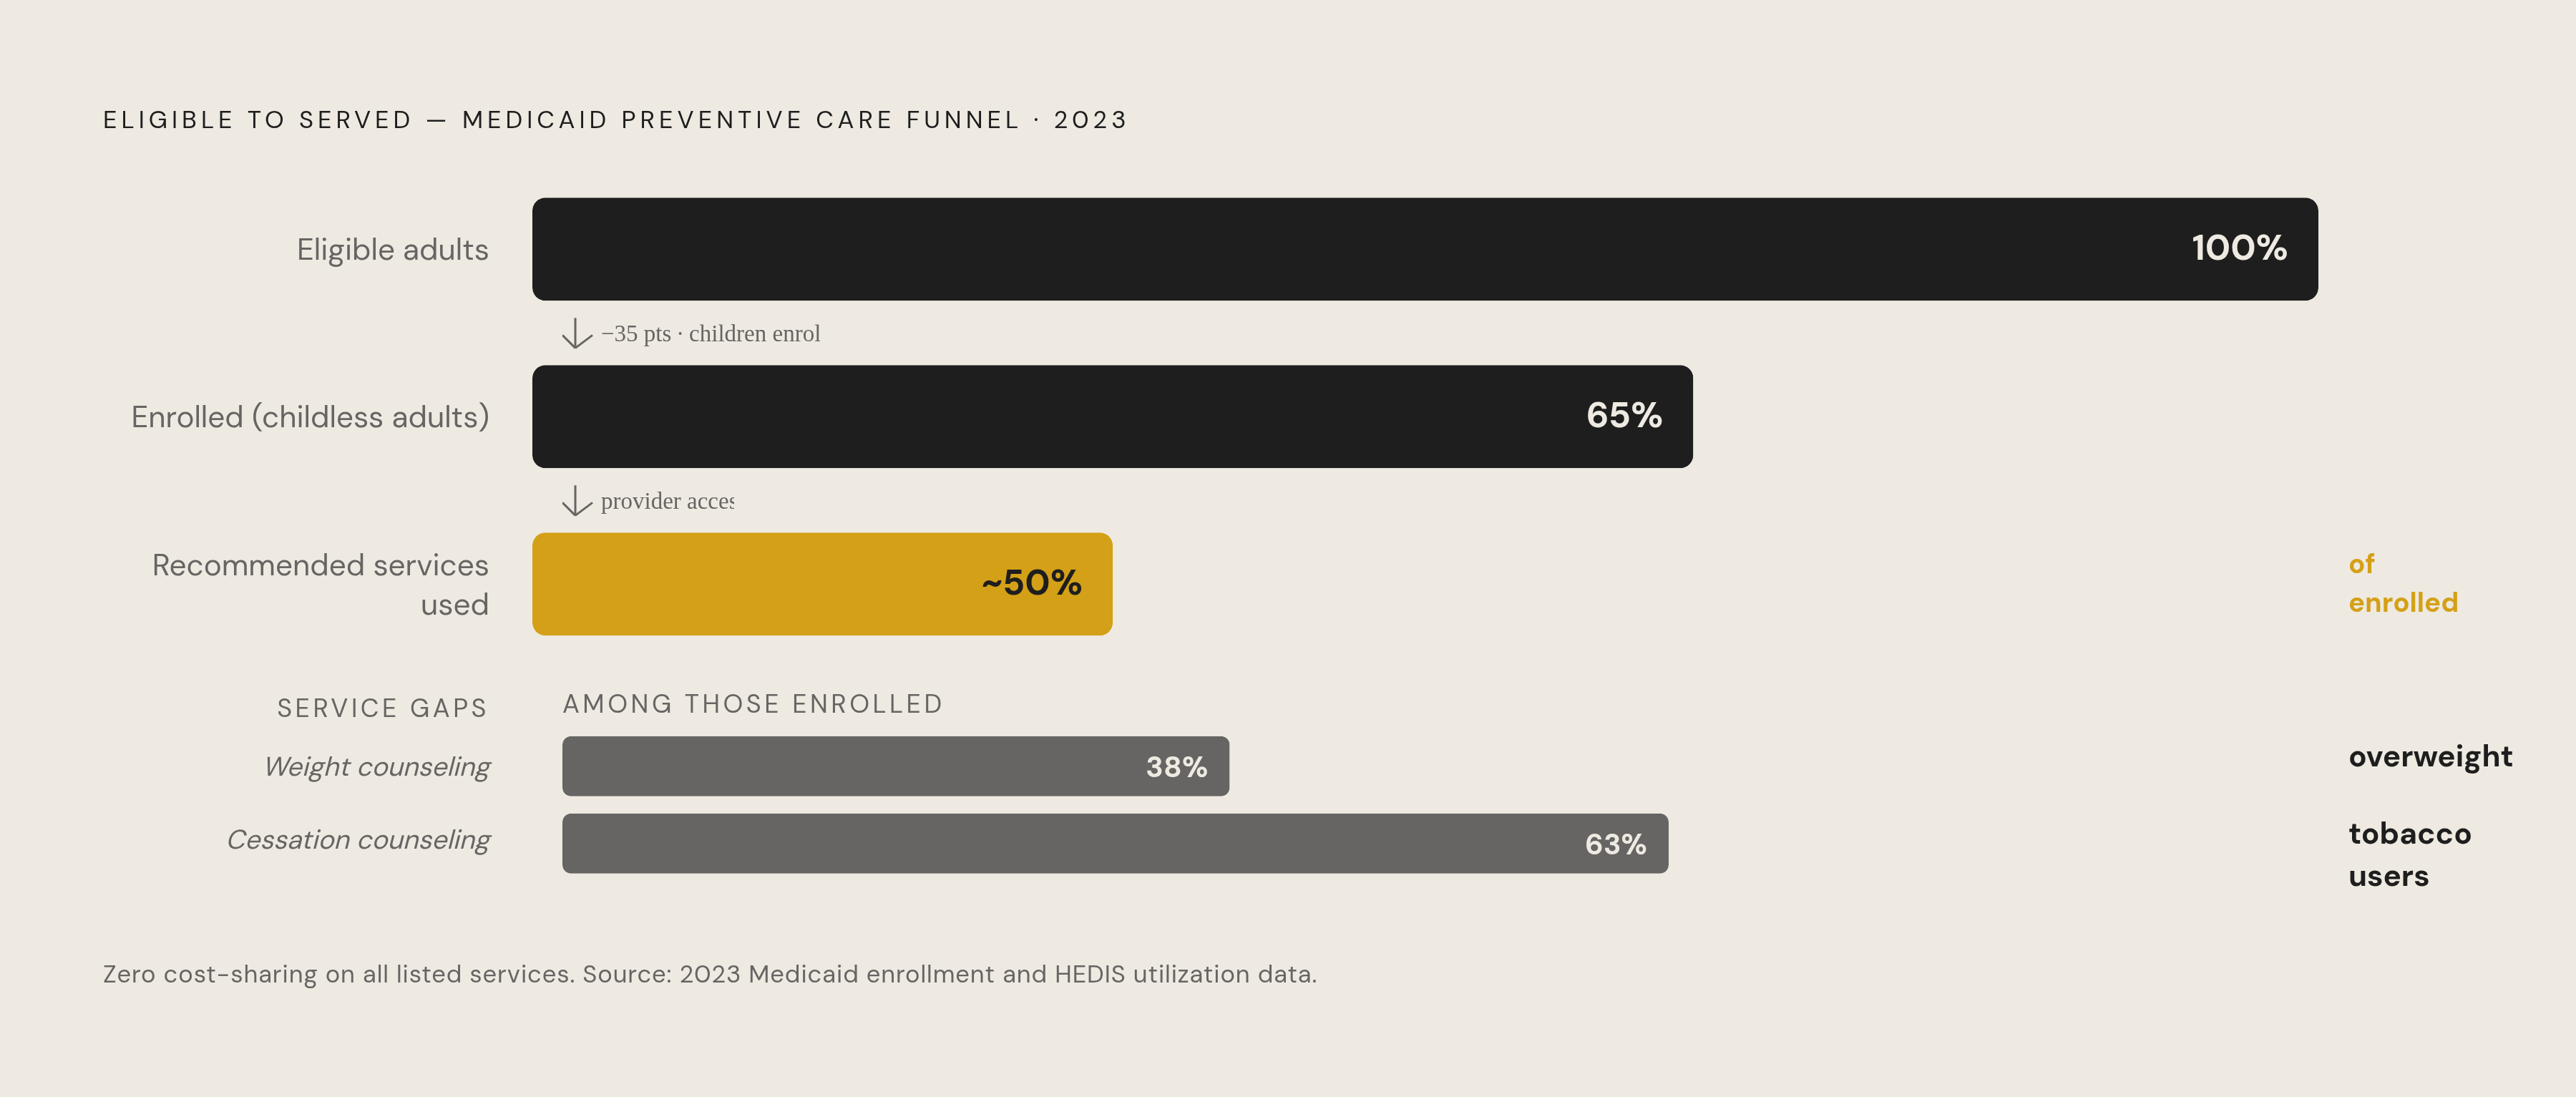
The figure that should anchor this entire discussion: despite zero cost at the point of care, only about half of recommended preventive services are actually used across the Medicaid population. Cost is not the binding constraint. So why are people forgoing services that are free? That question is more uncomfortable than it sounds. It forces a reckoning with every assumption that treating coverage as the destination tends to produce, and most policy conversations don't linger there long enough.
Where Geography Determines Whether Coverage Translates Into Access
Ten states still have not expanded Medicaid under the ACA. In those states, a specific structural trap operates: people with incomes below 100 percent of the federal poverty level, $15,060 for an individual in 2024, are ineligible for marketplace subsidies because those subsidies were designed assuming Medicaid would cover this income band. In non-expansion states, Medicaid eligibility for parents in the median state is set at just 35 percent of the federal poverty level, roughly $9,037 annually for a family of three. Adults without children are generally ineligible regardless of income.
The uninsured rate in non-expansion states is 70 percent higher than in expansion states, at 14.5 percent as of March 2024. That is not a marginal difference.
But expansion itself reveals something that the political accounting around it tends to obscure. A 2025 study published in AJPM Focus examined North Carolina's newly eligible expansion population and found an estimated 186,000 newly eligible individuals still lacked a regular source of care, with significant gaps persisting across wellness visits, dental care, and cancer screening. The expansion population was healthier, on average, than the traditional Medicaid population, and yet reported lower access to preventive care across nearly every measured dimension. A door opened. People still could not get through it. That finding is harder to sit with than the expansion-versus-non-expansion comparison, because it removes the easy explanation.
Who Remains Uninsured Even When Eligible
Geography sets the outer boundary, but enrollment gaps exist well inside that boundary too. A Johns Hopkins study published in the Milbank Quarterly in May 2025 drew on population-wide data from more than 2.5 million U.S. residents between 2008 and 2023. In 2023, only 65 percent of eligible childless adults were enrolled in Medicaid, compared to nearly 94 percent of eligible children. Take-up was significantly lower in rural areas than in urban ones, a gap that widened rather than narrowed after ACA implementation.
These enrollment gaps are not randomly distributed. American Indian and Alaska Native communities and rural populations are specifically underrepresented among enrolled eligibles. The 27 million who lost coverage during post-pandemic redeterminations, many not for ineligibility but for paperwork failures and outdated addresses, represent a separate but related layer: people who were enrolled, lost coverage through administrative attrition, and may not have re-enrolled.
Utilization rates measured only among enrollees miss this population entirely. The true scale of the preventive care gap is wider than enrollment-based statistics suggest, and interventions calibrated to the enrolled population are, by design, incomplete. We are measuring the visible portion of a larger problem and then designing for it as if it were the whole thing.
How Low Provider Payment Rates Erode Access for Enrolled Patients
Once someone is enrolled, the next obstacle is supply-side. Medicaid reimbursement rates are consistently below Medicare rates, which are themselves below private insurance rates. Physicians and practices operating on thin margins cannot absorb that differential across a significant share of their patient panel without threatening economic viability. The AMA has documented provider participation concerns grounded precisely in this arithmetic. The result is a familiar paradox: coverage without access, where enrollees hold a card that fewer providers can afford to accept.
Policy responses have emerged. Since 2022, the Centers for Medicare and Medicaid Services have approved Section 1115 demonstrations requiring states to increase payment rates for primary care, obstetrics, and behavioral health as a condition for receiving additional federal matching funds. In fiscal year 2024, more than half of states reported rate increases for outpatient behavioral health providers, primary care providers, and dentists. The direction is correct. Whether the effects on actual provider participation hold over time remains uncertain, and I am skeptical of anyone who claims otherwise at this stage.
Rural areas feel the payment rate problem most acutely. The Johns Hopkins enrollment study found take-up gaps concentrated in rural communities where provider shortages exist independently of reimbursement. Low rates remove any economic incentive for additional providers to enter those markets. The supply problem in rural Medicaid is not simply about money, but money makes every other dimension of it structurally harder to solve.
The Logistical and Social Barriers That Remain Even When a Provider Is Available
Assume, for a moment, that an enrollee has coverage, lives in an expansion state, and has a primary care provider willing to see them. The barriers are not over.
The work schedule problem is consistently underappreciated. Preventive visits require time away from work, and for hourly workers, that time means lost wages even when the visit itself costs nothing. The visit is free; the afternoon is not. This is an entirely routine calculation that shapes whether someone books an appointment they could, in theory, afford.
Research has consistently found that having an ongoing primary care relationship is associated with significantly higher preventive health behaviors. The relationship between those variables runs in both directions: people without a care relationship are less likely to use preventive services, and people who rarely use preventive services are less likely to develop a care relationship. The absence of continuity is both cause and effect, which is part of why it is so difficult to interrupt from the outside.
Evidence from Medicaid expansion bears this out. Even following coverage gains, many newly insured individuals used preventive services well below recommended rates. Extending insurance coverage does not automatically produce corresponding increases in utilization. The interaction of factors shaping whether someone actually receives a preventive service is considerably more complex than a coverage-access equation, and designing policy as if it were simpler consistently produces interventions that shift the bottleneck rather than remove it.
How Specific Preventive Services Reveal Where Utilization Breaks Down
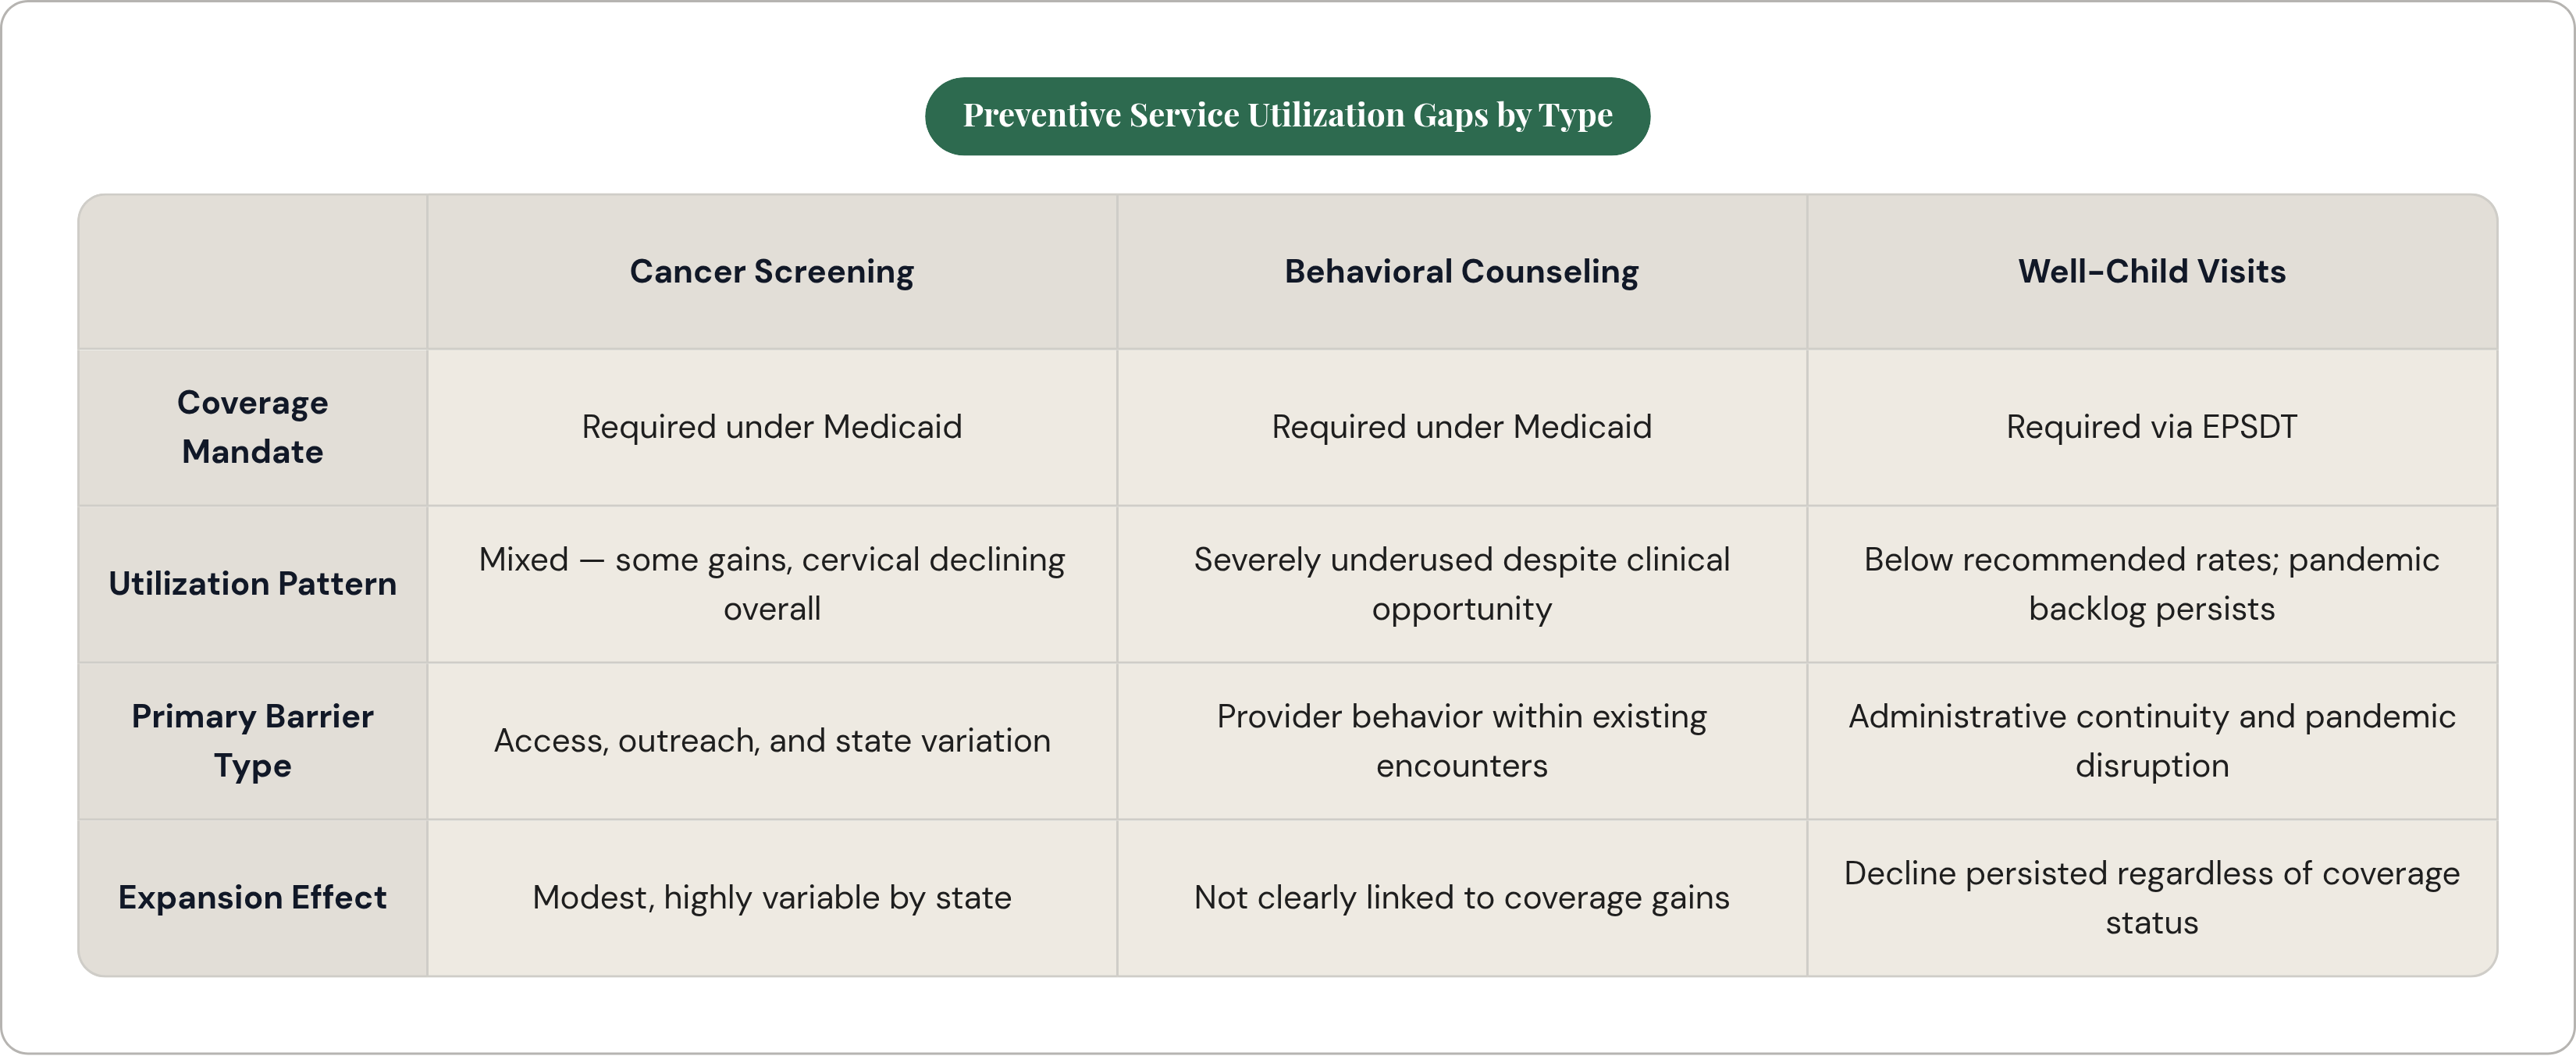
The gaps are not uniform across service types, and the variation is instructive. Some services have improved with expansion; others have declined. The patterns suggest which barriers are doing the most work in any given context.
Cancer Screening
A 2024 analysis published in Gynecologic Oncology found that Medicaid expansion states showed a 1.1 percentage point greater increase in cervical cancer screening compared to non-expansion states. Expansion helps, but modestly and unevenly: among individual expansion states, increases in cervical screening ranged from roughly 2.8 percentage points to 8.5 percentage points, with substantial variation between them. State-level implementation choices and outreach infrastructure appear to matter as much as expansion status itself.
Across tracked populations, colon cancer screening and HIV testing increased; breast cancer screening held steady; cervical cancer screening showed a declining trend overall. These services do not move together. The barriers shaping each are distinct and will not yield to a single intervention. That heterogeneity is diagnostic information, and program design tends to underuse it.
Counseling Gaps
Only 38 percent of overweight or obese adult Medicaid beneficiaries receive counseling from providers. Only 63 percent of tobacco-using adult Medicaid beneficiaries receive counseling, despite smoking affecting close to one in three enrollees. These gaps are not logistical in the way a missed mammogram might be. Counseling should happen within a clinical encounter the patient already attended. The failure is located at the provider-patient interaction level, implicating training, time pressure, reimbursement structures for counseling visits specifically, and clinical culture. That is a different category of failure from an access failure, and conflating the two produces interventions that address neither.
Well-Child Visits
The American Academy of Pediatrics recommends eleven well-child visits through the first 30 months of life. EPSDT mandates coverage for this and a comprehensive range of developmental and preventive services for children. But mandate is not receipt. Children over age three enrolled in Medicaid or CHIP experienced larger pandemic-era declines in well-child visit rates than younger children, and a cross-sectional study of more than 89,000 U.S. adults published in JAMA Health Forum in 2024 found that wellness visits and screenings for blood pressure, cholesterol, blood glucose, and common cancers had not returned to pre-pandemic levels as of 2022. The backlog is clearing on its own schedule, regardless of the administrative pressure to treat the pandemic as a closed chapter.
How Racial and Ethnic Disparities Layer Onto Every Other Barrier
The structural, geographic, and logistical barriers documented above do not fall evenly across the Medicaid population. Race and ethnicity shape who bears the compounded burden, and that cannot be treated as a separate analytical thread; it runs through every layer already described.
Medicaid- and CHIP-enrolled children are disproportionately children of color, and they experience higher rates of multiple chronic conditions and unmet health-related social needs compared to children in higher-income households. The disparities in their access to preventive care stem from policies that have historically exposed communities of color to greater environmental health hazards, from implicit bias within clinical encounters, and from geographic concentrations of poverty that map directly onto provider shortage areas. These are not incidental patterns.
One gap in the data infrastructure deserves particular attention: states are not required to report EPSDT performance metrics stratified by race or ethnicity. The disparities that exist within the program are structurally obscured by the reporting framework itself. The Johns Hopkins enrollment study specifically identified lower take-up among American Indian and Alaska Native communities. The JAMA Health Forum analysis found that post-pandemic screening recovery varied across racial and ethnic groups. Where restoration of utilization has occurred, it has occurred unevenly, and the measurement infrastructure does not require states to document that unevenness with any precision. You cannot close gaps you are not required to see.
What Closing These Gaps Actually Requires
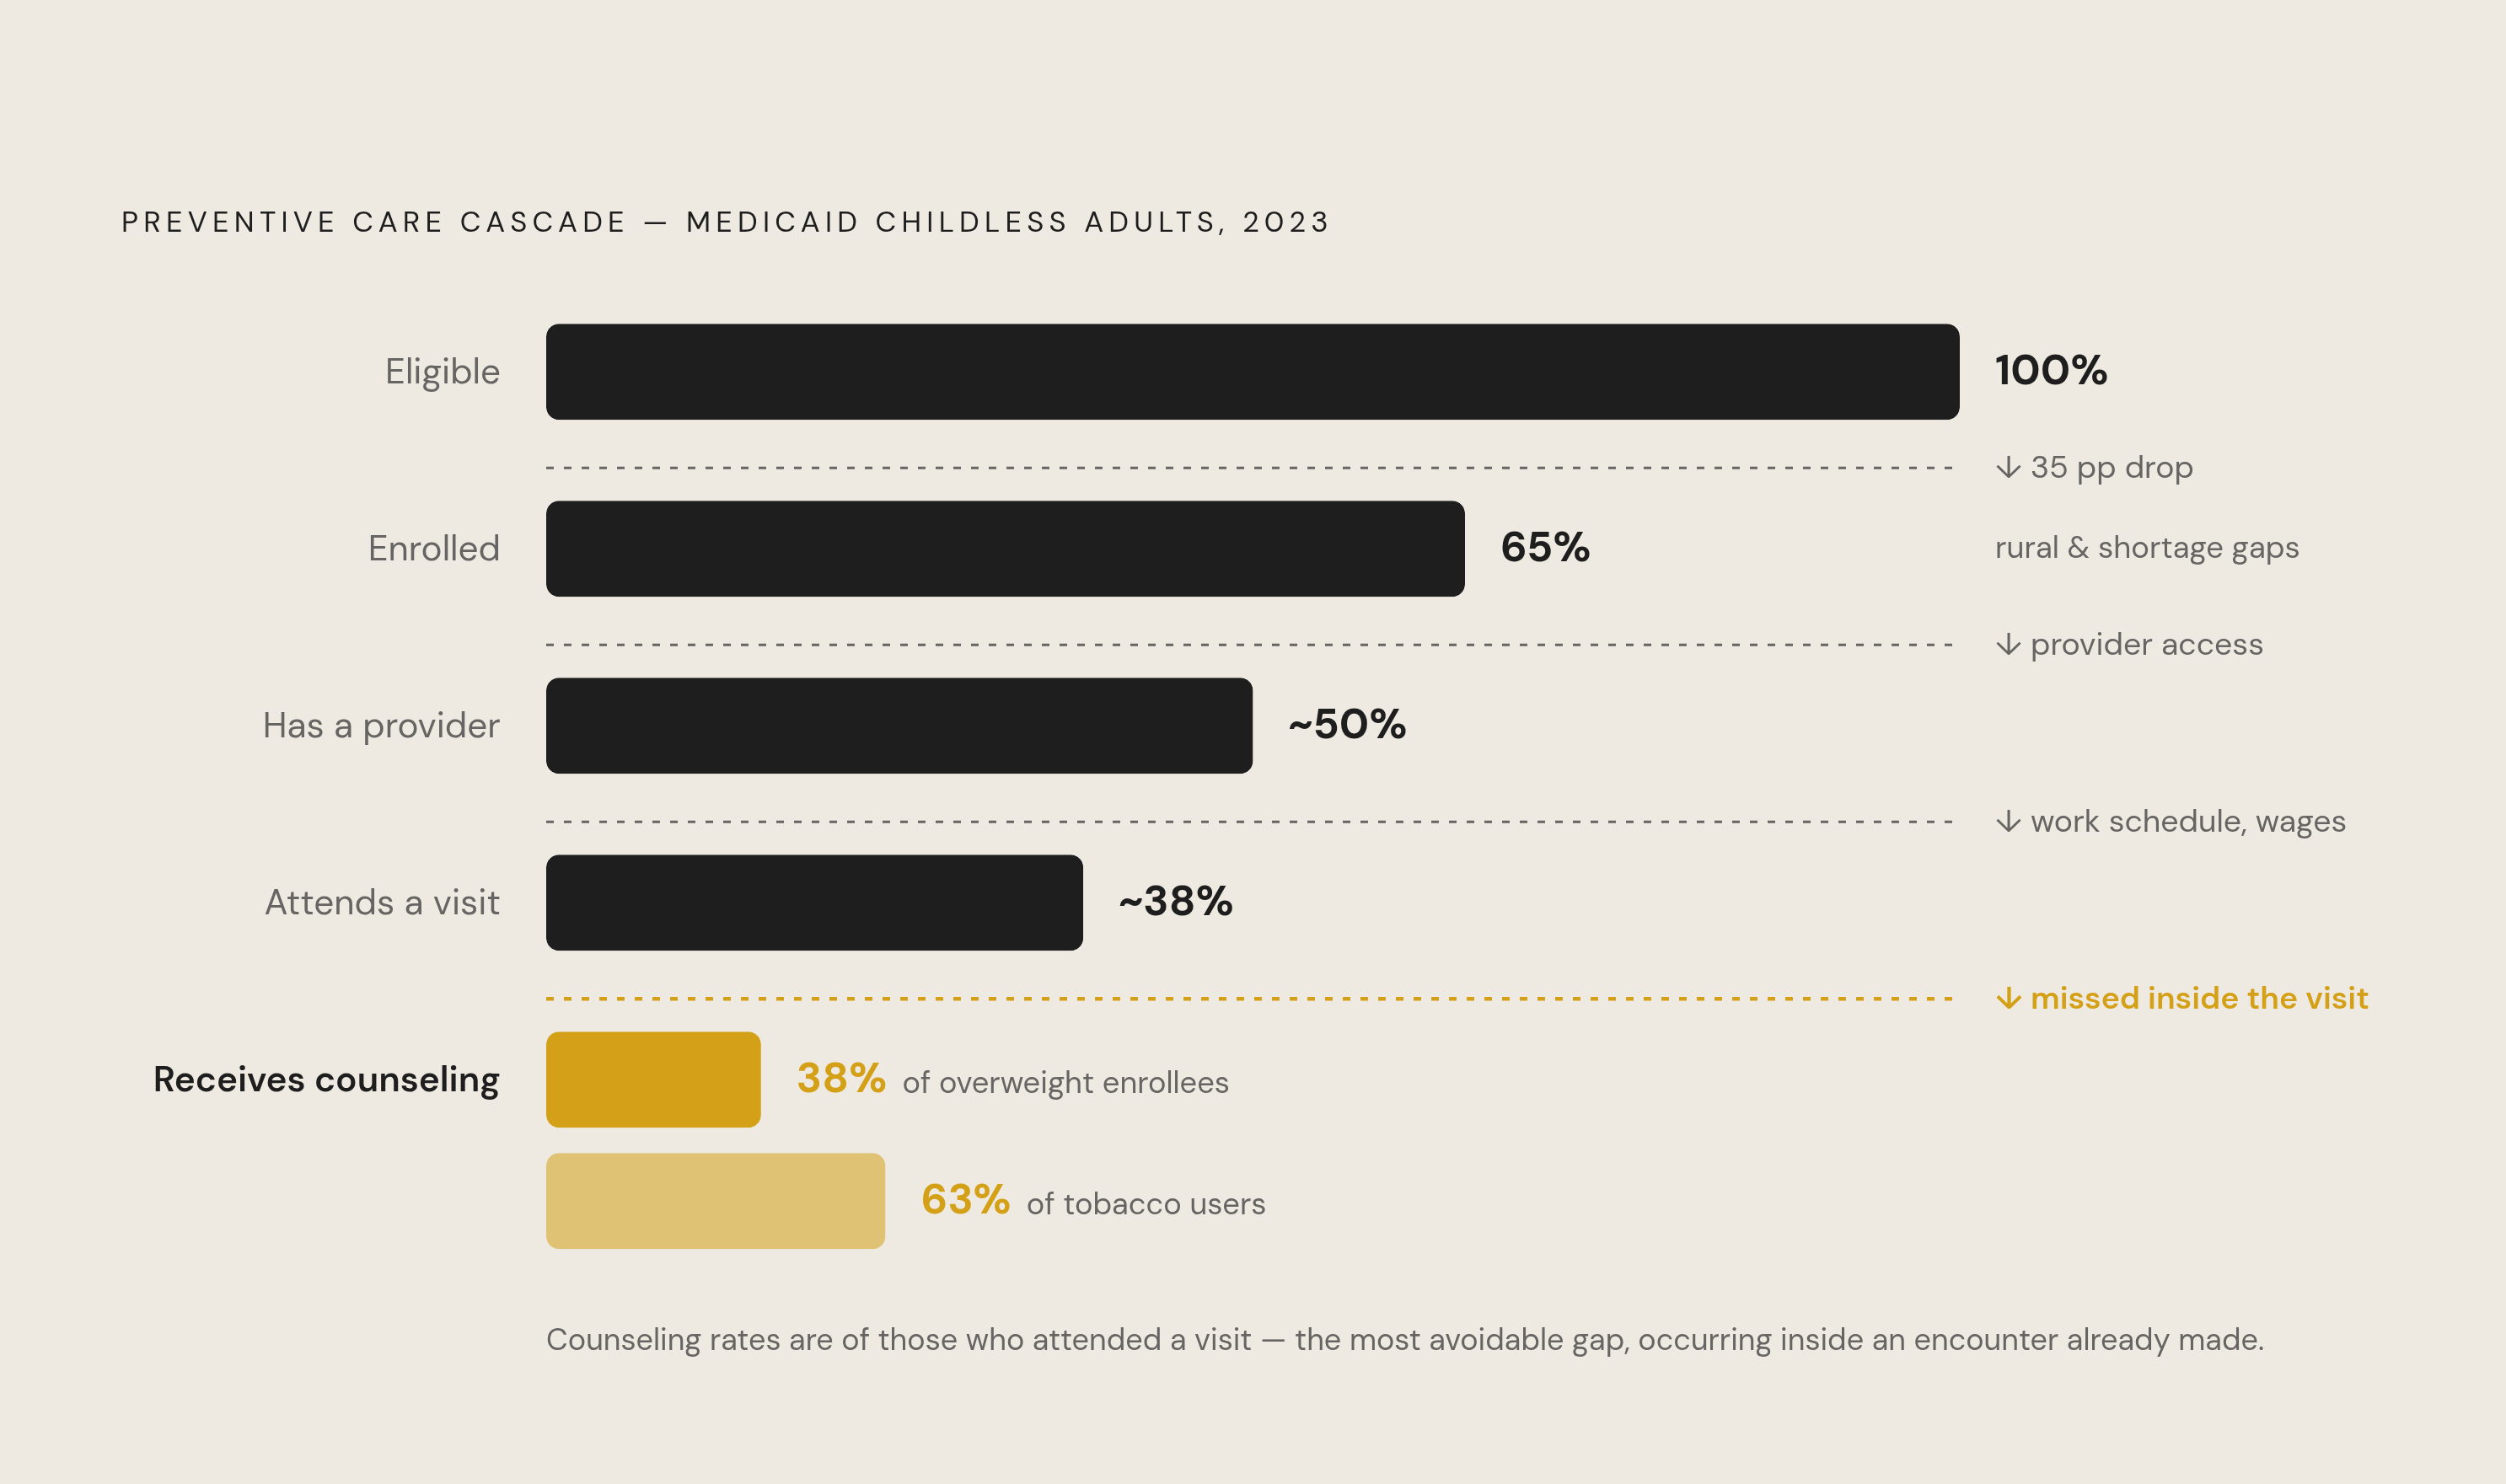
Coverage is necessary. It is also plainly insufficient. Enrollment, provider supply, logistical access, an ongoing care relationship, and trust in the clinical encounter all have to be present simultaneously for preventive care to actually happen. Any one element missing is enough to suppress utilization.
Policy levers are moving in the right direction. CMS payment rate requirements tied to demonstration approvals, mandatory Child Core Set reporting beginning in 2024, and state-level rate increases for primary care and behavioral health represent real structural changes with sensible premises: if providers can afford to participate, more will; if states must measure and report on child health metrics, they will have reason to invest in performance. These are worth tracking carefully.
But these levers do not touch another set of problems: the absence of paid sick leave, the cultural barriers embedded in clinical encounters, the lack of ongoing care relationships for people who have spent years outside the system, and the enrollment gaps that leave more than a third of eligible childless adults outside the program entirely, concentrated among already underserved populations. No payment rate adjustment touches any of that.
The North Carolina expansion case keeps pulling me back precisely because it removes the easy explanation. A population that gained coverage, was relatively healthy compared to traditional Medicaid enrollees, and still showed significant preventive care gaps across nearly every measured dimension. The barriers downstream of coverage were not addressed by coverage. Something different was required. The evidence does not yet tell us clearly what that something is at scale, and I think being straightforward about that uncertainty is more useful than projecting confidence we don't have.
What the evidence does show is that barriers cluster. A rural enrollee who cannot find a Medicaid-accepting provider is also the person least likely to have paid sick leave and most likely to lack an ongoing care relationship. Geographic, administrative, economic, logistical, and cultural barriers do not simply add to one another; they interact, and they tend to concentrate on the same people. Interventions calibrated to one layer at a time have a structural tendency to relocate the bottleneck rather than close it. Recognizing that tendency, rather than assuming away the layers we find hardest to address, is probably where real progress begins.