Environmental Health Hazards in Frontline Communities
Pollutants concentrate where marginalized communities live, creating preventable disease clusters.
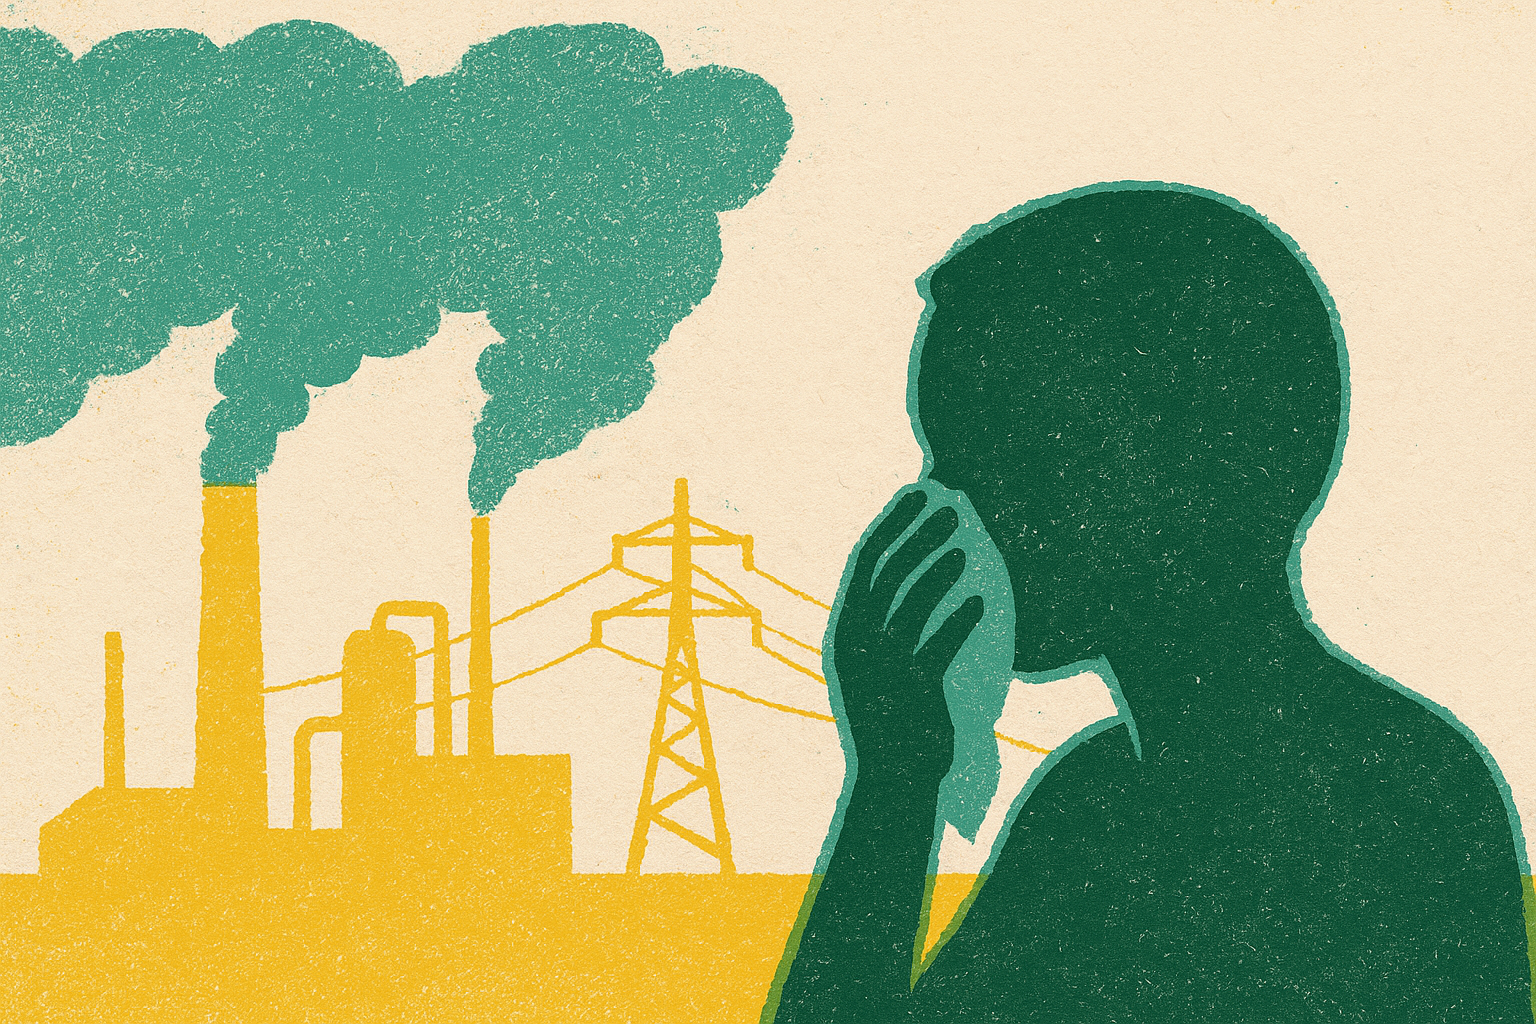
Start with the number, because the number reframes everything: millions of deaths per year, according to the World Health Organization, are attributable to modifiable environmental risks. One in four deaths worldwide. The burden concentrates among children under five and populations in low- and middle-income countries, but the social gradient the WHO describes does not stop at national borders. A scoping review drawing on peer-reviewed literature indexed through NCBI and NIH, covering 2018 through 2021, documented the same pattern within wealthy nations: marginalized communities absorb disproportionately higher environmental exposures than more advantaged groups, consistently, across geographies.
The domestic numbers are proportionally smaller but not small. The American Lung Association's 25th annual State of the Air report, published in 2024 and covering 2020 through 2022 data, found that tens of millions of people in the United States were still breathing unhealthy air. Pair that against the WHO global mortality figure and what you have is a problem that is neither abstract nor foreign. It is ongoing, measurable at the neighborhood level, and almost certainly present within driving distance of wherever this is being read.
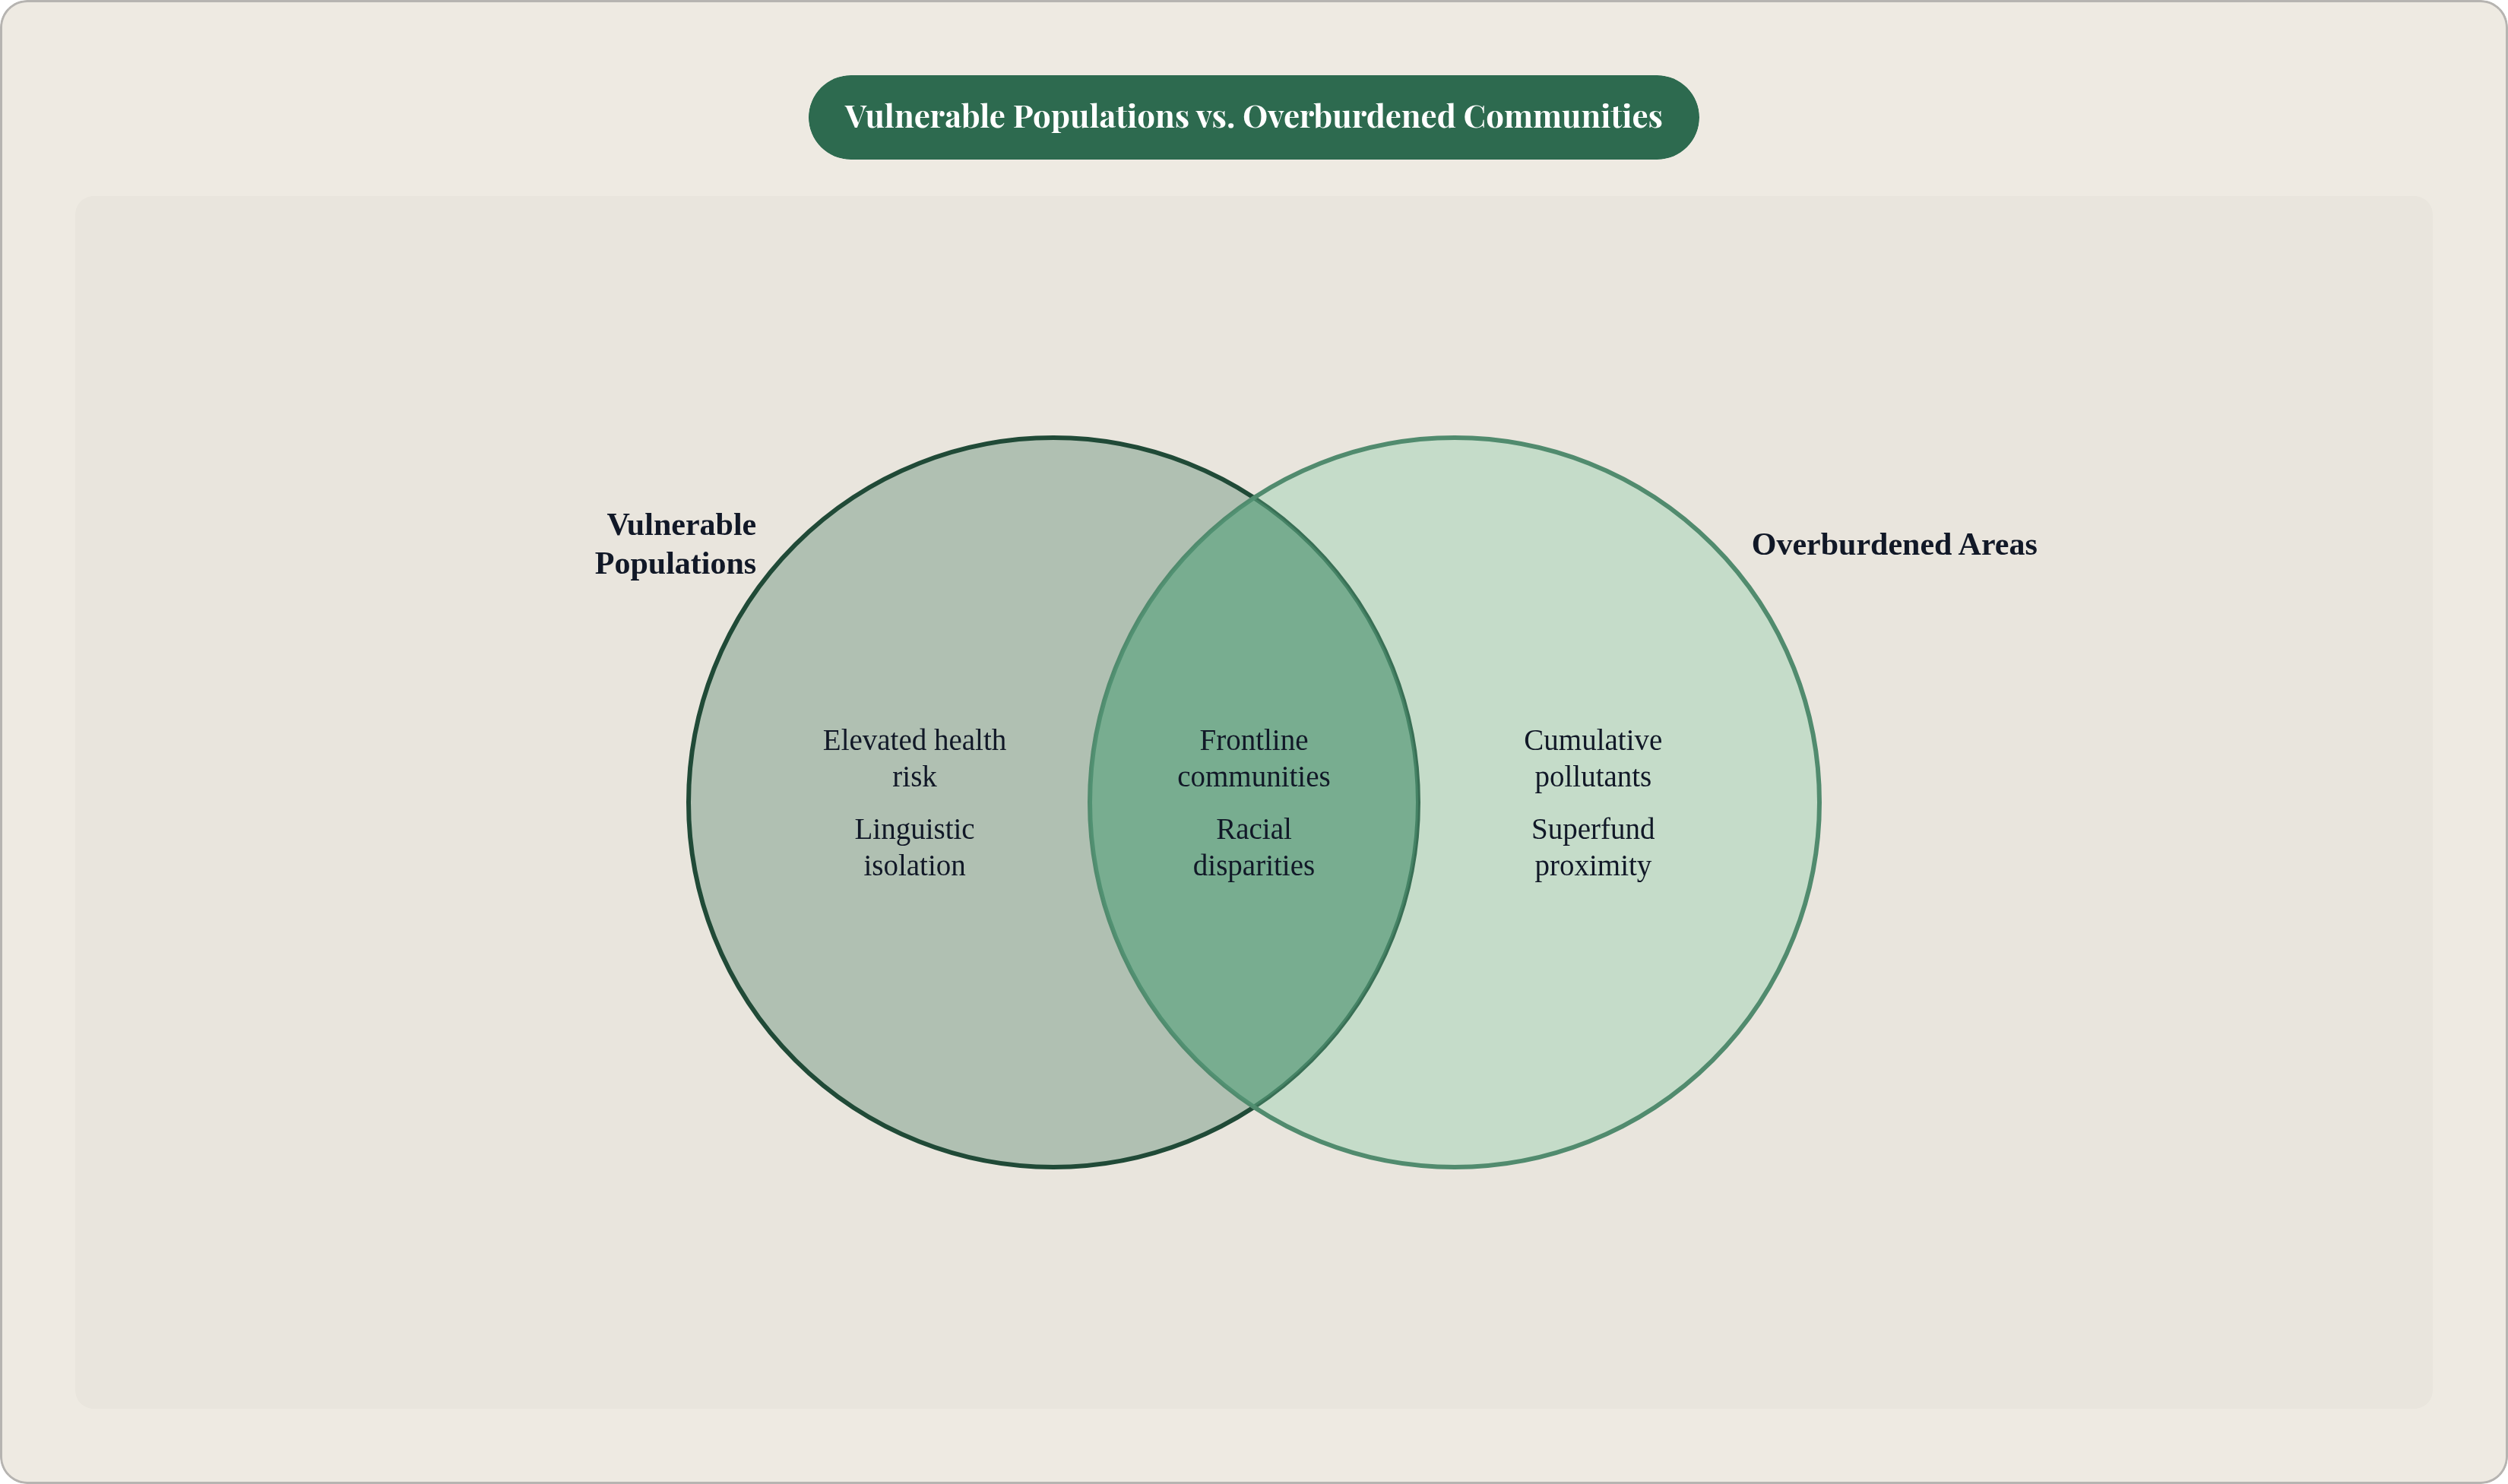
Two categories matter for what follows. "Vulnerable populations" refers to people at elevated risk because of race or ethnicity, income, food and healthcare access, linguistic isolation, or particular health sensitivity, such as children and outdoor workers. "Overburdened communities" refers to geographic areas, including Tribal lands, where vulnerable populations face combined or cumulative pollutant exposure. The overlap is the point. The people most susceptible to environmental harm tend to live in the places most saturated with it, a geography shaped by decades of racially and economically discriminatory decisions about where to site industrial facilities, where to invest in green space, and where to maintain aging infrastructure. Frontline communities are disproportionately lower-income and disproportionately Black, Hispanic and Latino, and Indigenous. Worth noting: how a government defines "frontline" is itself contested, because the definition determines who receives resources, who gets a seat at the permitting table, and who qualifies for legal protection. Definitional choices are policy choices.
Air Pollution as the Most Pervasive Daily Hazard in Frontline Neighborhoods
Two pollutants are responsible for the most extensively documented harm: fine particulate matter, PM2.5, and ground-level ozone. Both are linked to respiratory disease, heart disease, and cancer. The 2024 State of the Air report found that tens of millions of people lived in counties that experienced unhealthy particle pollution spikes, the highest count in 14 years. The three-year window the report examined also captured the highest number of "very unhealthy" and "hazardous" particle pollution days in the report's 25-year history. The trend line moved in the wrong direction.
There is real progress to acknowledge before going further. PM2.5 from fossil fuel combustion fell 40.4% nationally between 2000 and 2016. That is a real policy success. But Black and Latiné communities carried a persistent disproportionate burden even as aggregate national numbers improved. Cleanup measured at the national level does not automatically reach the most exposed communities. Diesel traffic is the concrete illustration: diesel trucks and locomotives moving through frontline neighborhoods contribute to nearly 9,000 premature deaths per year. The 40.4% improvement and the persistent racial disparity are not contradictory; they coexist because pollution reduction has not been spatially uniform. That gap is a policy consequence, even when it is an inadvertent one.
Toxic Waste Sites and Who Lives Nearest to Them
Proximity to toxic waste sites is not random, and the scale is larger than most people register. More than 20 million Americans live within one mile of a toxic waste site. More than 60 million, roughly one in six, live within three miles. Over 1,300 sites currently sit on the National Priorities List guiding Superfund investigation and remediation.
Communities nearest the most hazardous sites, those processing metals, industrial chemicals, wood waste, and battery materials, are more likely to be lower-income, have lower educational attainment, and have large racial or ethnic minority populations. The disparity extends past proximity, however. Low-income communities near hazardous waste sites are also less likely to have their sites promoted to the federal National Priorities List, which means less cleanup funding arrives, and it arrives later. Researchers link this to lower social capital and fewer political resources: communities without the organizational capacity to navigate regulatory processes tend to wait longer and receive less. Proximity alone understates the harm. Whether a site gets cleaned up, and at what pace, is itself distributed unequally.
How Combined Air Toxics Translate Into Elevated Cancer Risk
A 2024 study published in Environmental Science and Technology matched U.S. Census Bureau data to EPA-estimated cancer risks from airborne toxics at census-tract resolution, covering 2011 through 2019. It found positive associations between high proportions of Black residents in suburban and rural areas and increased estimated cancer risk. The methodological contribution matters as much as the finding: census-tract resolution makes geographic targeting of risk visible in ways that aggregate, county-level data routinely obscures. Zoom out and disparities can average away. Zoom in and they sharpen.
A 2024 article in the Journal of the National Cancer Institute documented that racial disparities in cancer incidence and survival persist, and in some cases are widening. The analysis identifies structural racism as the primary driver, not as a catch-all explanation, but as the mechanism that produces elevated environmental hazard exposure, disrupts access to care, and compounds health outcomes across a lifetime. What these two studies together establish is a direct line: environmental exposure is not a parallel track running alongside cancer outcomes. It feeds into them. The racial pattern in exposure predicts the racial pattern in disease.
Cancer Alley as the Concentrated Version of a Nationwide Pattern
Cancer Alley is the most cited example of concentrated industrial pollution in the United States, and the scale earns the attention. Roughly 350 industrial facilities line the Mississippi River corridor between Baton Rouge and New Orleans, the largest concentration of fossil fuel and petrochemical plants in the Western Hemisphere. As of 2025, the corridor accounts for approximately 25% of U.S. petrochemical production. Cancer incidence rates in affected areas reach as high as 47 times the EPA's acceptable rate. Black communities bear the heaviest burden, a distribution researchers tie to systemic racism embedded in generations of industrial siting decisions.
A Johns Hopkins University study published in the Proceedings of the National Academy of Sciences in October 2025 field-measured 17 carcinogenic air pollutants across four parishes and found cancer risks up to 11 times higher than previously estimated by government models. Eleven times. That is not a rounding error. Regulatory benchmarks built on modeled data rather than on what researchers actually detected in the air residents breathe have systematically underprotected these communities. The government's own tools were calibrated to something other than actual exposure.
The pollution reaches beyond cancer. A 2024 Tulane Environmental Law Clinic study found preterm birth and low birthweight rates as much as triple the U.S. average in the most polluted census tracts within Cancer Alley. As of April 2025, EPA rules that would have reduced chemical air toxics compliance, the Hazardous Organic National Emission Standards (HON rules), were suspended for two years, removing the most immediate regulatory remedy available to these communities.
Lead in Drinking Water and the Infrastructure Dimension of Cumulative Burden
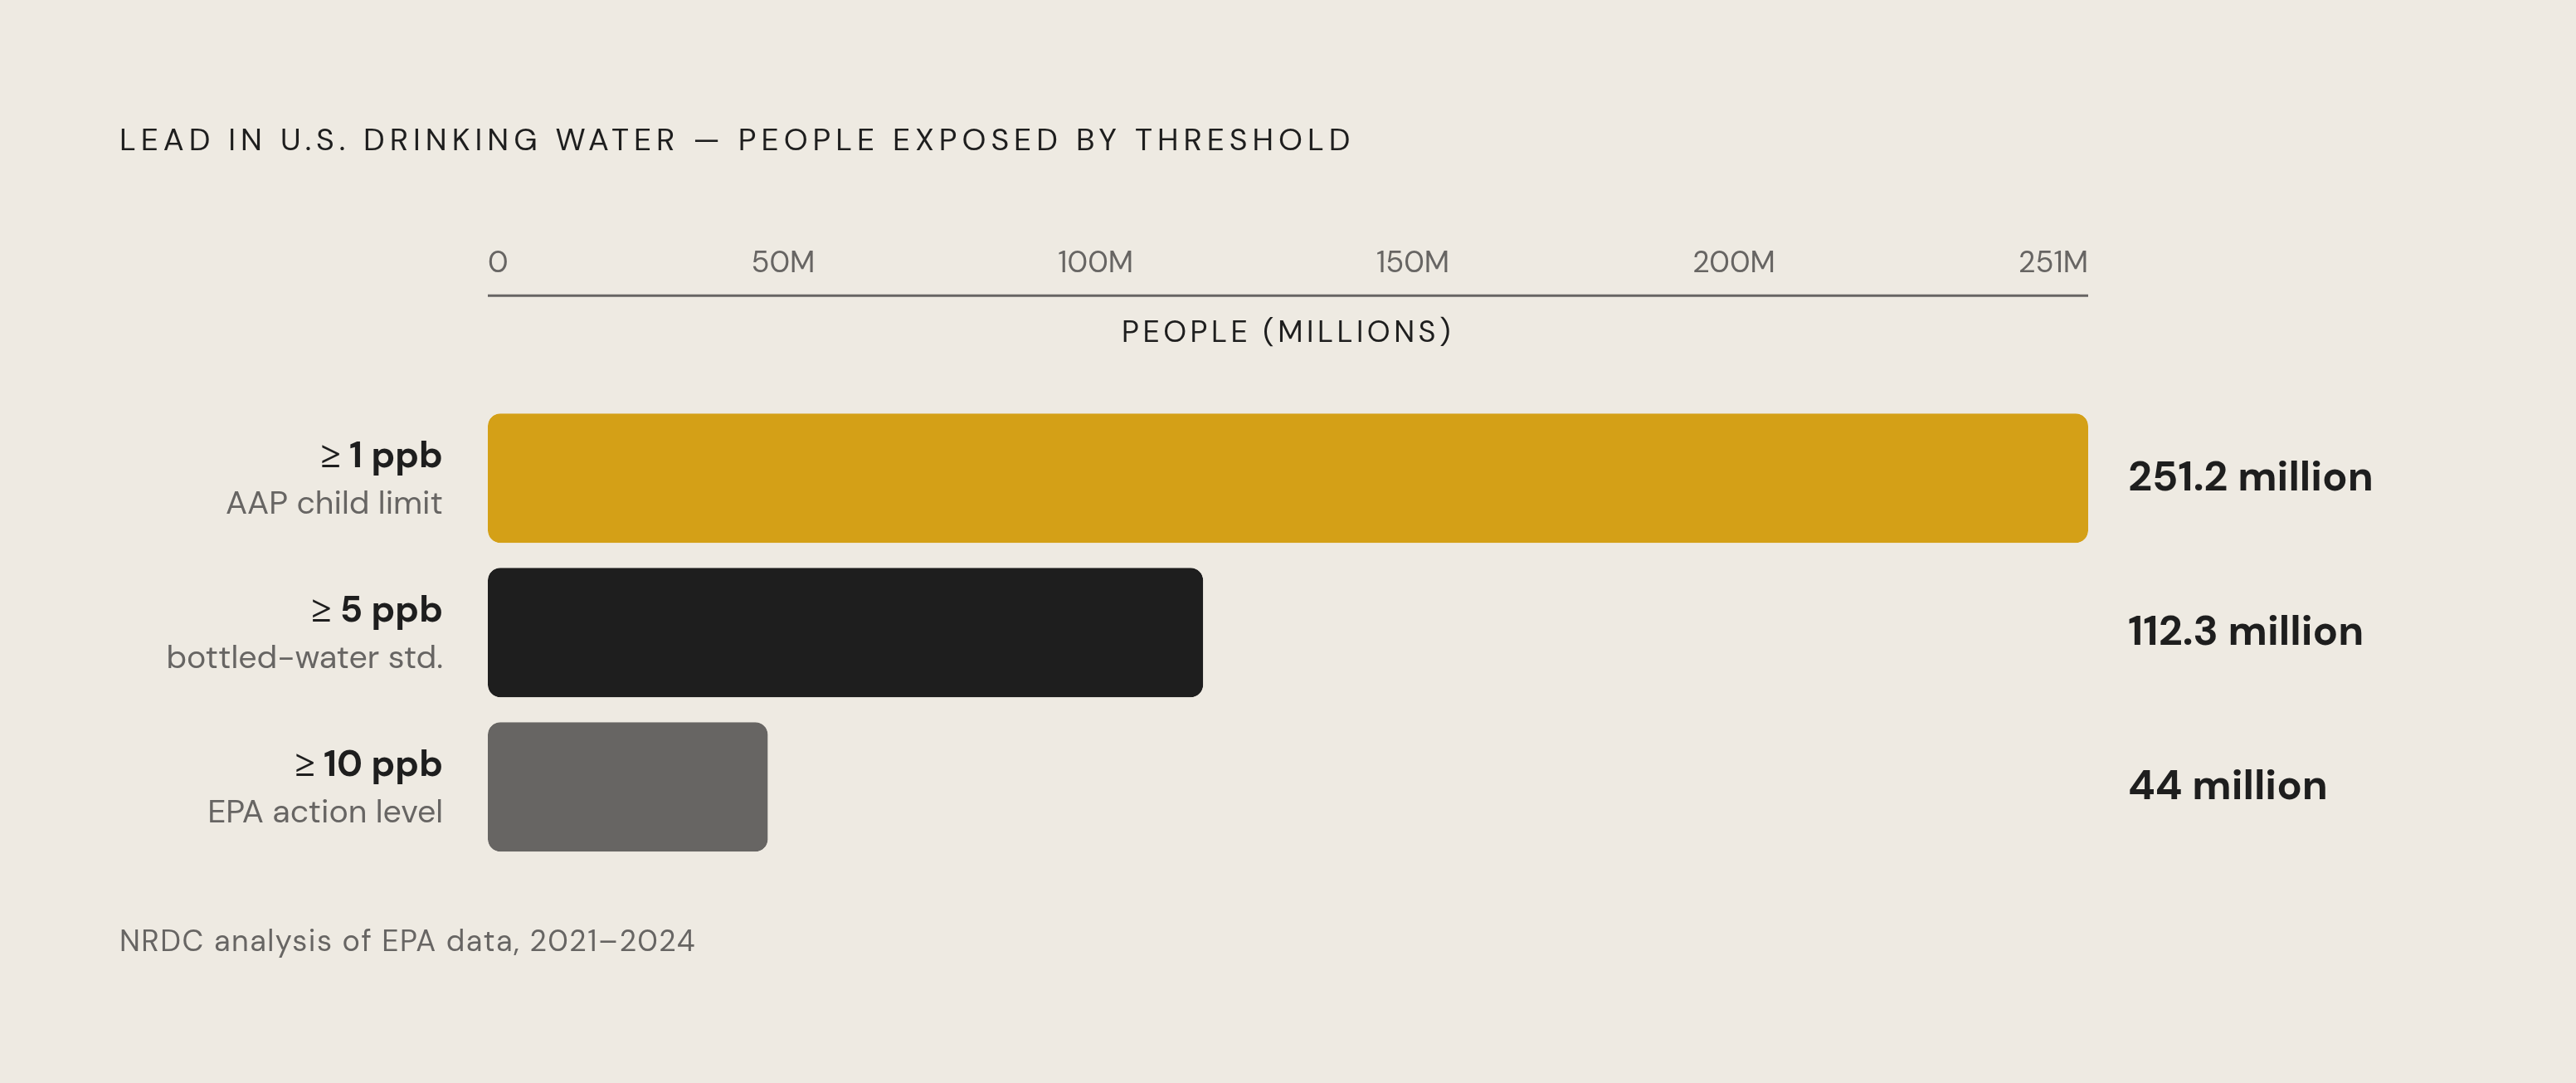
Lead exposure differs from air pollution and Superfund proximity in one critical way: it arrives through infrastructure that communities did not choose and cannot individually fix. NRDC analysis of EPA data from 2021 through 2024 found that 251.2 million people's water systems detected lead at or above 1 part per billion, the American Academy of Pediatrics' recommended maximum for children. 112.3 million received water from systems detecting lead at or above 5 parts per billion, the standard applied to bottled water. 44 million received water from systems detecting lead at or above the EPA's current 10 parts per billion action level.
The NRDC's 2024 Environmental Justice Report found that communities of color and low-income neighborhoods are two to three times more likely to have lead service lines. The infrastructure carrying elevated risk follows the same social geography as every other hazard examined here. In children, even low-level lead exposure produces developmental problems, reduced IQ, behavioral dysfunction, and anemia. In adults, consequences include cardiovascular damage, impaired kidney function, and reproductive harm.
In October 2024, the EPA finalized Lead and Copper Rule Improvements requiring water systems to identify and replace lead pipes within ten years. The 2021 Bipartisan Infrastructure Law committed $15 billion specifically to lead pipe replacement. These are real commitments. The question implementation will answer is whether replacement reaches the highest-risk communities first, or whether resources again flow toward communities with greater political capacity to claim them.
Extreme Heat as Both a Climate Hazard and a Compounding Health Risk
Heat-related deaths in the United States increased by 117% between 1999 and 2023. The frequency of extreme heat events in U.S. cities rose from an average of two per year in the 1960s to ten per year between 2010 and 2020, and the heat-wave season has lengthened by 46 days since the 1960s. These are historical measurements of a hazard that has already accelerated, not projections of one that might.
The racial mortality gap under heat is among the starkest figures in environmental health data. Compared with non-Hispanic White individuals, non-Hispanic Black individuals experienced a fourfold increase in the proportion of excess cardiovascular disease deaths for each additional day of extreme heat per month. Between 2018 and 2021, American Indian and Alaska Native people had the highest rate of heat-related deaths among all racial and ethnic groups. The structural reasons are the same ones producing every other disparity catalogued here: lower rates of air conditioning access, residence in urban heat islands created by historical disinvestment in vegetation and permeable surfaces, higher rates of outdoor employment in agriculture and construction, and poorer baseline health from existing pollution exposures.
Each of those factors is independently addressable. Combined, they create a vulnerability profile that no single intervention fully resolves. Community-level heat exposure monitoring remains poor, and where monitoring is weakest, harm is most likely underestimated. Monitoring tends to be weakest in the communities already carrying the most cumulative burden.
Why the Hazards Multiply Rather Than Simply Add Up
A resident of a Cancer Alley parish, a Chicago diesel corridor, or a post-industrial Midwestern city is not facing one hazard. They are facing air toxics, proximity to Superfund sites, aged lead-pipe infrastructure, and intensifying heat simultaneously, and these hazards do not simply coexist: they interact.
Heat stress worsens respiratory outcomes from PM2.5 and ozone. Lead exposure impairs cardiovascular and neurological resilience, raising susceptibility to heat-related death. Poorer baseline health from any one exposure amplifies the damage from every other. The same communities carrying the heaviest pollution burden also have reduced access to healthcare, green space, and climate adaptation resources. Every protective buffer is thinner precisely where it is most needed.
Regulatory structure has historically addressed these hazards one at a time, through a single-pollutant, single-statute framework not designed to see cumulative load. Tools like the EPA's EJScreen environmental justice screening index represent a meaningful shift in how policy attempts to see the whole picture. But the Cancer Alley field-measurement study makes the limitation of the older approach concrete: when researchers measured actual cumulative exposure rather than modeling individual pollutants in isolation, risk estimates were dramatically higher. Single-hazard models have structurally undercounted the burden on frontline communities. The consequence is direct: which regulatory thresholds get set, and which communities get protected, have both been shaped by an incomplete picture.
What Cumulative Burden Data Reveals That Single-Hazard Studies Miss
Single-hazard analyses can show that a community is near a Superfund site, or has unhealthy air, or has lead pipes. They cannot show that the same people face all three simultaneously, and they cannot capture how combined effects diverge from any one alone. The data gaps identified in heat research apply across every hazard category: where monitoring is weakest, harm is most likely underestimated, and monitoring tends to be weakest in the communities already most burdened. It is a self-reinforcing blind spot, and it runs through the entire regulatory apparatus.
Participatory approaches have a specific evidentiary role that the field is still learning to use. Frontline community members often hold knowledge of local exposure patterns, from diesel truck routes to flooding frequency to industrial odor events, that government monitoring networks fail to capture. That knowledge is spatially precise and temporally continuous in ways that fixed monitoring stations, limited in number and placement, cannot be. Treating it as merely anecdotal is itself a methodological choice, and it has consequences for whose risk gets counted.
For anyone working to understand why health gaps between racial and income groups persist even as individual pollutant levels fall, the cumulative burden framework provides the answer that single-metric analyses cannot furnish. No single measurement captures the full load any one community carries. The WHO's 2024 update of health-and-environment scorecards for 194 countries, assessing eight major environmental threats simultaneously, reflects growing international recognition that multi-hazard frameworks are necessary to see actual burden rather than a partial projection of it.
What remains unresolved, and I am uncertain how quickly it will be, is the translation problem. The tools for counting overlapping harms have outpaced the tools for addressing them. Cumulative burden indices can identify which communities face the heaviest combined exposures. They cannot yet compel commensurate regulatory and remediation responses, and the political will to build that bridge is itself unevenly distributed, concentrated, predictably, away from the communities with the most to gain. That gap, between measurement and remedy, is where the next phase of this work lands, and it is not a comfortable place to end up.