Chronic Disease Rates in Low-Income Communities
Poverty and geography compound chronic disease risk in ways clinical treatment alone cannot address.
Chronic disease does not fall on a population randomly. The longer you work in public health, the harder it becomes to look at prevalence data without seeing, underneath the numbers, the layered architecture of circumstance that produced them. Income is one of the most reliable predictors we have of whether a person carries one chronic condition or several. That observation is not new. What deserves closer examination is why the gap between high- and low-income adults has failed to narrow over time for most of these conditions, and in some cases has widened.
A 2024 CDC analysis of 324,631 adults using Behavioral Risk Factor Surveillance System data found that 66.3% had one or more chronic diseases, while 59.4% reported one or more adverse social determinants of health. The near-overlap of those two figures is worth sitting with. We are not talking about distinct populations with distinct problems. We are, to a substantial degree, talking about the same people. And the life-expectancy data makes the stakes concrete: men in the top 1% of income are expected to live 14.6 years longer than men in the bottom 1%; for women, that gap is 10.1 years, per the Office of Disease Prevention and Health Promotion's summary of poverty-related health literature. A decade and a half of life. That is not a marginal disparity.
The question this piece is exploring is not whether the gap exists. It is what actually produces it, and whether our interventions are aimed at the right level.
What the disease-by-disease breakdown actually shows
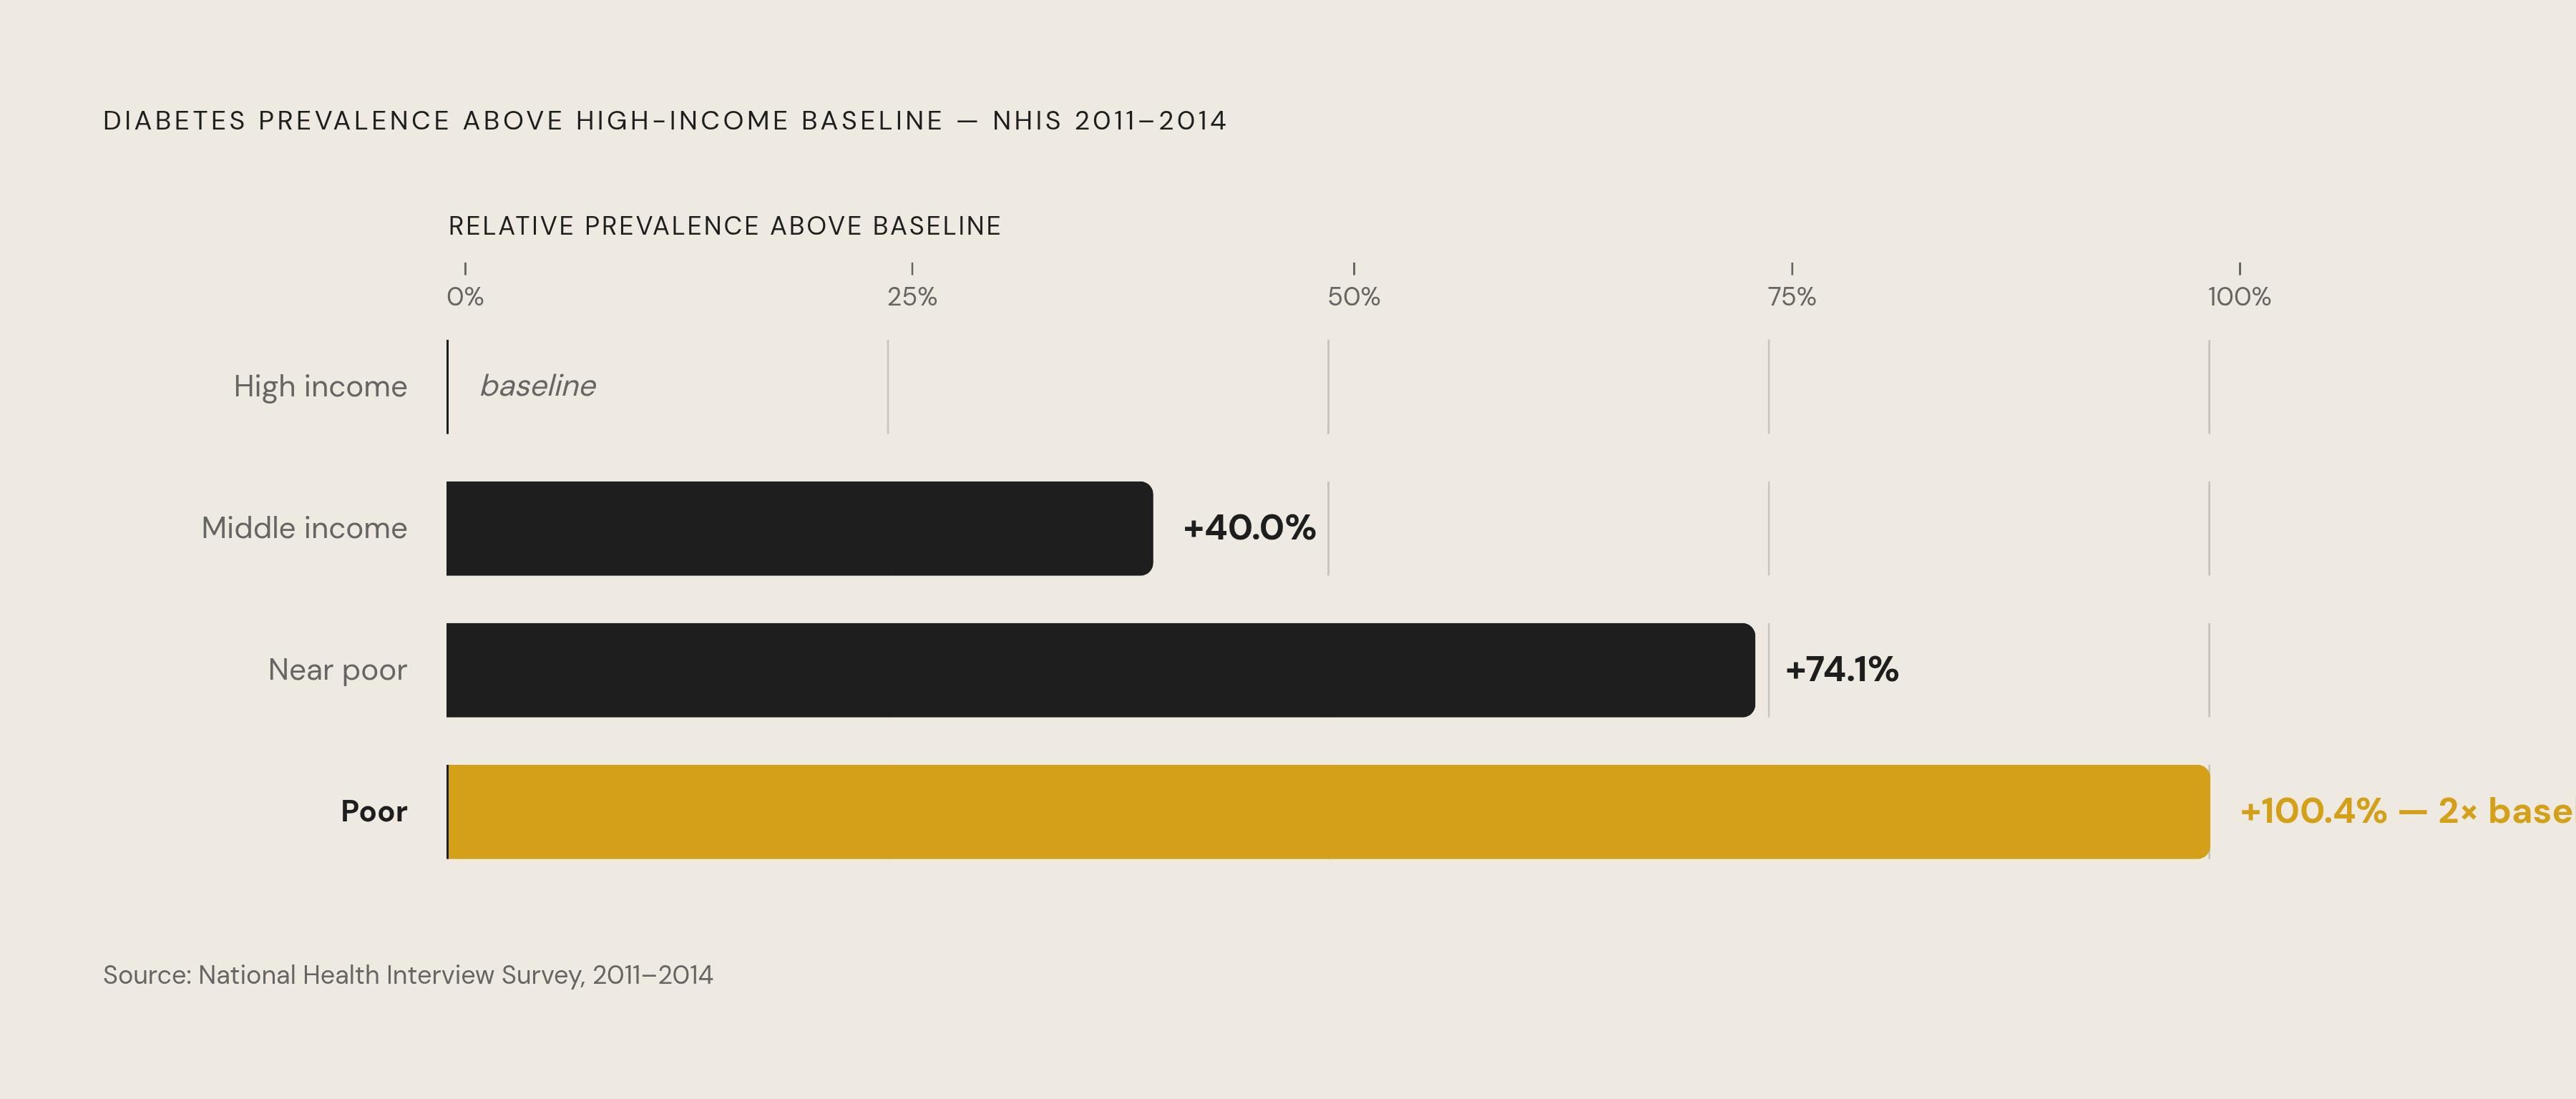
Diabetes offers perhaps the clearest income gradient in the chronic disease literature. National Health Interview Survey data from 2011 to 2014 found that, compared with high-income adults, diabetes prevalence was 40.0% higher among middle-income adults, 74.1% higher among near-poor adults, and 100.4% higher among poor adults. That last figure is not a rounding error. It represents a doubling of prevalence at the lowest income tier. What makes it more troubling is that these gaps were wider than in the comparable 1999 to 2002 period. The disparity is holding steady in no sense; it has been growing.
Hypertension follows a similar pattern, though the mechanism through which income shapes blood pressure is more diffuse, running through chronic stress, diet, sleep disruption, and healthcare access simultaneously. The national average prevalence sits at 32.4%, a number that, like most national averages, obscures more than it reveals. In high-poverty urban neighborhoods, such as New Orleans' Read/Bullard area, hypertension prevalence reaches 39.9%. New Orleans also carries an adult diabetes prevalence of 13.4%, compared to a national average of 9%. These are not outliers to be explained away; they are concentrated expressions of a national pattern.
Obesity functions as something of a connective tissue across this entire disease cluster. Among circulatory disease risk factors tracked in the 2019 to 2022 National Health Interview Survey, obesity had the highest prevalence across all years surveyed. It both predisposes individuals to other conditions and reflects the same upstream constraints, including food environment, physical activity access, and chronic stress physiology, that drive the broader burden.
Food insecurity is where the upstream and the clinical meet most directly. USDA Economic Research Service data from 2019 to 2022 found predicted chronic disease prevalence 3.6 to 9.5 percentage points higher for adults in very low food-secure households compared to high food-secure households, among those at or below 200% of the federal poverty level. That range covers conditions from diabetes to cardiovascular disease to kidney disease. Income doesn't predict just one condition; it predicts the whole cluster. That convergence is the signal worth following.
Why geography concentrates the burden further
A 2024 CDC study published in Preventing Chronic Disease found that chronic disease prevalence was highest in the southeastern United States, with the highest-burden communities tending to be smaller in population, older, more socioeconomically disadvantaged, and having a higher proportion of Black and American Indian/Alaska Native residents. None of those characteristics are independent of one another. They reinforce each other in ways the national data cannot capture.
What that study also found is that residents in the highest-prevalence areas had to travel substantially longer distances for healthcare than those in the lowest-prevalence areas. The map of chronic disease burden and the map of care access are, to a meaningful degree, inversions of each other. The populations who need the most clinical contact have the hardest time reaching it.
Rural mortality data for hypertension and obesity illustrates a related dynamic. From 1999 to 2023, non-metropolitan areas saw a faster average annual percent change in hypertension-obesity mortality, at 12.13%, compared to 10.73% in metropolitan areas. The rural condition is accelerating, diverging from rather than converging with urban trends.
I want to be precise about what geography is doing analytically here. It is not a descriptor, a background detail, or a proxy for culture. It is a mechanism. When poverty, food insecurity, provider shortages, and limited infrastructure co-locate in the same zip codes, they interact. Each barrier makes the others harder to surmount. A person managing diabetes in a rural county without reliable transportation to a clinic, without a pharmacy within reasonable distance, and without access to fresh food is not facing three separate problems. They are facing one compound problem with three faces. Historical underinvestment and economic marginalization are what produced these spatial concentrations; the disease patterns that follow are downstream consequences of those conditions.
How social determinants compound one another
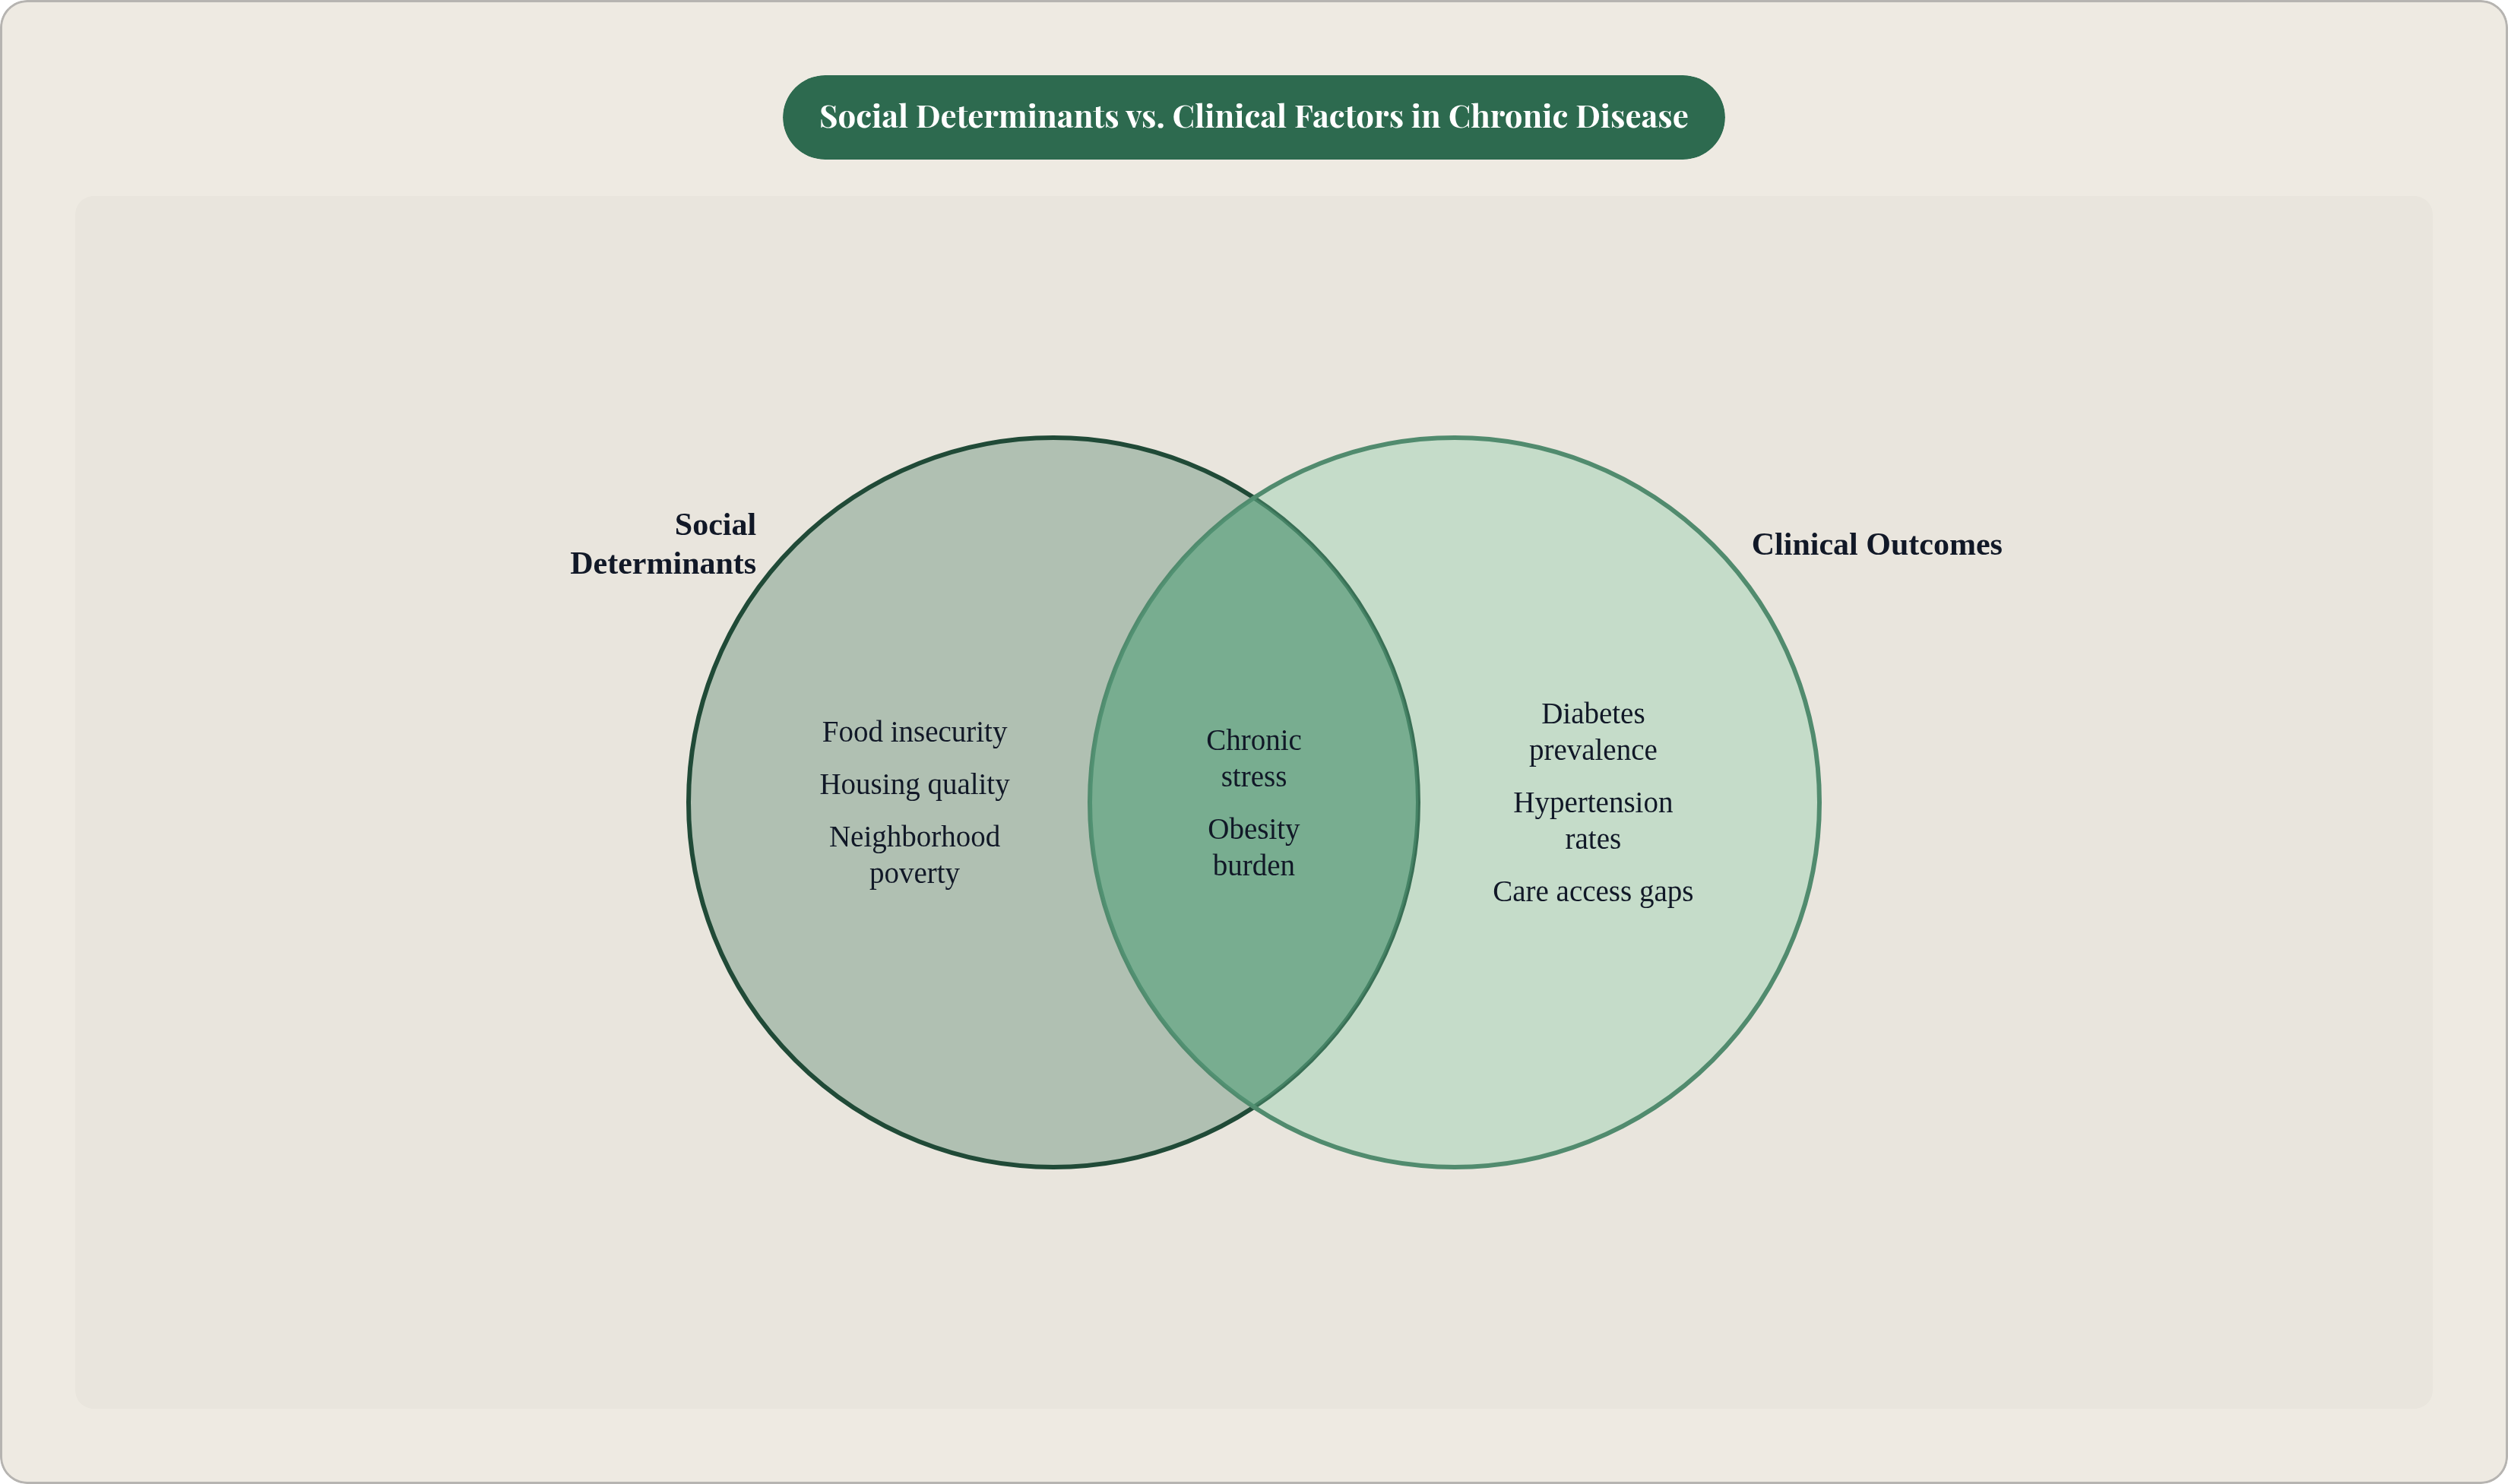
The CDC-cited research finding that up to 50% of health outcomes are shaped by social determinants of health and socioeconomic factors is one of those statistics that, once you accept it, reorients the entire frame around what healthcare can accomplish. Clinical care operating in isolation cannot close a gap whose origins are, by that estimate, at least half structural.
The 2024 BRFSS study referenced earlier makes the compounding dynamic visible at the individual level. The more chronic conditions a person had, the more social needs they identified. Cost barriers to medical care, mental stress, and SNAP participation were the most common social determinants associated with each chronic disease in the dataset. The relationship is not one-directional. Disease creates social need; social need makes disease harder to manage; each reinforces the other.
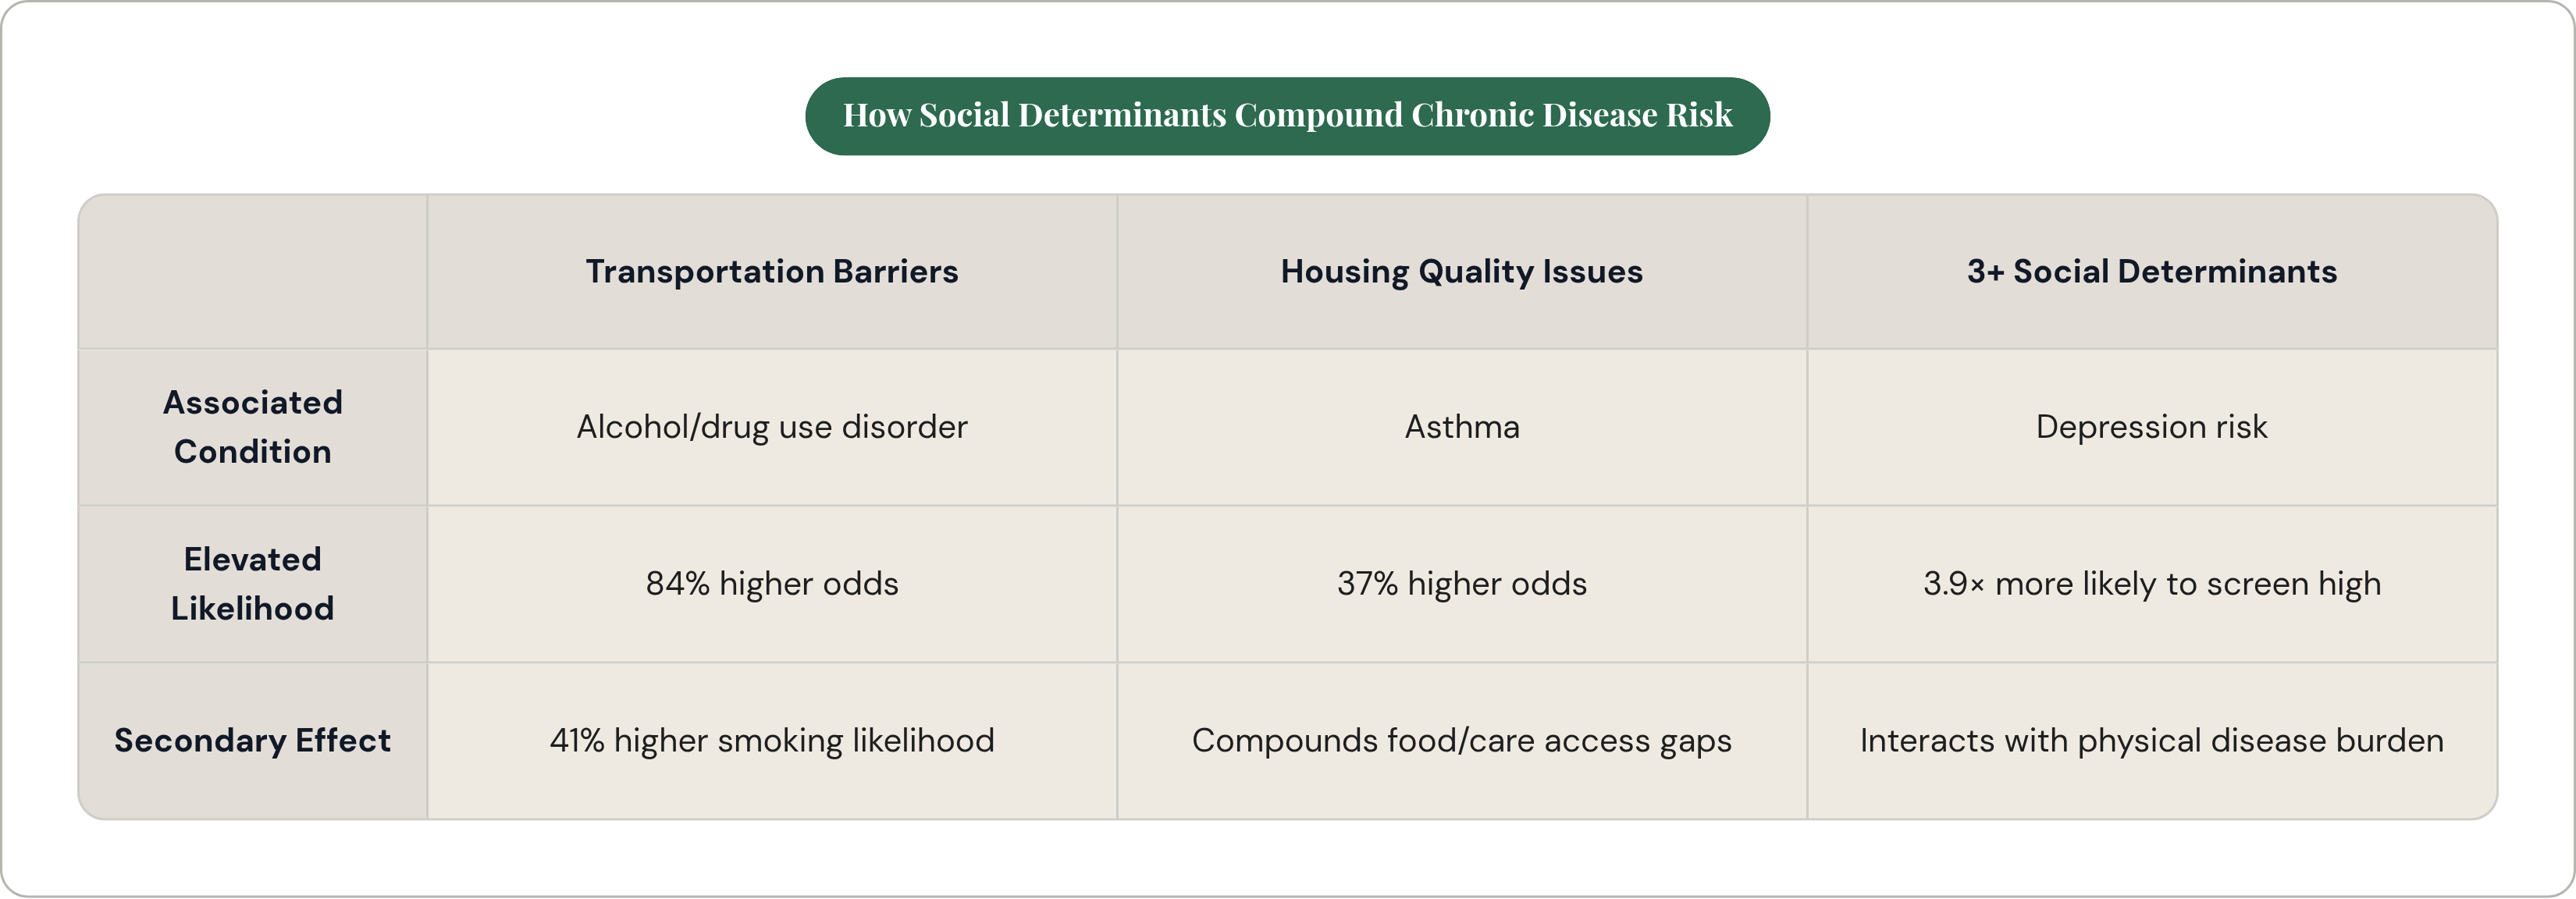
A 2022 study in Preventive Medicine gives this compounding more granular shape. People with three or more social determinants of health present were 3.9 times more likely to screen high for depression risk. Transportation barriers alone were associated with an 84% higher likelihood of alcohol or drug use disorder and a 41% higher likelihood of smoking. Housing quality issues were associated with a 37% higher likelihood of asthma. These are not small effect sizes, and they are operating in ways that interact with one another.
Food deserts offer a useful worked example of how compounding functions at the neighborhood level. The USDA defines a low-access urban area as one where at least 33% of the population lives more than half a mile from a large grocery store. That definition, dry as it is, maps onto elevated prevalence of type 2 diabetes, cardiovascular disease, hypertension, cancer, and chronic kidney disease. Not one condition; several. The absence of a supermarket is not mere inconvenience. When convenience stores and fast food outlets dominate a neighborhood's food retail, what's realistically available to eat shifts at a population level, regardless of individual preference or nutritional knowledge.
Transportation barriers are underappreciated as a connective constraint. A 2025 Georgia State University study of a Food as Medicine program found that transportation barriers directly limited low-income patients' ability to access both healthcare and food support. A person who cannot get to a clinic and cannot get to a grocery store is not experiencing two inconveniences; they are experiencing a compounded deprivation in which each deficit makes the other more consequential. These factors do not add up linearly. They multiply.
How race, income, and chronic disease burden intersect
The income patterns described above do not map cleanly onto race, but they map closely enough that the two cannot be analyzed separately. Black Americans experience disproportionate burden across heart disease, diabetes, hypertension, obesity, and several cancers, conditions that track directly with the income and social determinant patterns already established. Median Black household income stood at $53,789, compared to $83,121 for non-Hispanic white households, and 16.9% of Black families lived in poverty, figures that contextualize the disease disparities without fully explaining them.
Life expectancy data as of 2023, per KFF, places American Indian/Alaska Native adults at 70.1 years, Black adults at 74.0 years, and white adults at 78.4 years. These are not gaps produced by a single mechanism. They reflect accumulated disadvantage across healthcare access, neighborhood conditions, occupational exposure, and chronic stress physiology, operating across decades and generations.
Multimorbidity research reveals an additional dimension: the timing of burden accumulation differs by race. In one longitudinal study, Black respondents began the observation period with 1.3 chronic diseases and ended with 3.3; white respondents began with 0.98 and ended with 2.8. Middle-aged non-Hispanic Black adults develop multimorbidity at an earlier age. The burden arrives sooner and compounds over a longer period of life.
A 2025 study using 2023 National Health Interview Survey data found that the health advantage typically associated with higher income is diminished for Black, Latino, and American Indian and Alaska Native adults. Higher socioeconomic status does not fully protect racialized minorities from the health consequences of structural racism. That finding is important because it separates two things that are often conflated: income-based disadvantage and race-based disadvantage. They overlap substantially, but they are not identical.
The breast cancer case makes this distinction concrete. Non-Hispanic Black women are approximately as likely to be diagnosed with breast cancer as non-Hispanic white women, but 40% more likely to die from it. The disparity is not in who gets the disease; it is in what happens afterward. That points toward access and quality-of-care gaps that persist even when income is held roughly constant, and it suggests that income-focused interventions, while necessary, will fall short on their own.
What this costs the healthcare system — and who pays
Cardiovascular disease alone killed more than 850,000 Americans in 2024. Direct healthcare costs run to $223.2 billion per year, with an additional $191.5 billion in indirect mortality costs, and the CDC projects those figures to approach $2 trillion by 2050. These are national aggregates, and they carry the same limitation as all national aggregates: they distribute a burden that is, in reality, concentrated. The populations carrying the highest disease burden are, as this piece has established, the same populations with the least financial capacity to absorb the costs of treatment.
Medicaid is the financing mechanism that catches most of this. Total combined state and federal Medicaid spending reached nearly a trillion dollars in fiscal year 2024, up substantially since fiscal year 2014, when states began expanding Medicaid to all low-income adults under the Affordable Care Act. That trajectory is not coincidental. It reflects a system structured to intervene after onset, in acute and emergency settings, rather than to reduce incidence by addressing the upstream conditions that produce chronic disease in the first place.
The fiscal logic points in a direction the political economy of healthcare has been slow to follow. A system that waits for hypertension to become a stroke, or for prediabetes to become type 2 diabetes with complications, pays many multiples of what prevention would have cost. The economic case for addressing social determinants is not a separate, softer argument grafted onto the clinical one. It follows directly from it.
What interventions can realistically accomplish given structural constraints
Having spent considerable time in and around community health programs, I have developed a particular skepticism of interventions that treat upstream problems with downstream tools. That skepticism is not cynicism; it is calibration. Some interventions do meaningful work, and they deserve honest assessment.
Community Health Workers represent one of the more structurally coherent responses available within current healthcare delivery models. They are frontline workers, often from the communities they serve, who can address the social determinant barriers that clinical encounters cannot reach: transportation logistics, food access, cost navigation, social support, and trust. The CDC identifies CHWs as a direct link between chronic disease management and social determinant navigation, and the evidence base for their effectiveness in reducing preventable utilization has grown steadily. They are not a solution at scale; workforce, training, and financing constraints limit reach. But they address the right problem.
Food as Medicine programs represent an emerging and promising category of intervention, one that treats food access as a clinical input rather than a lifestyle recommendation. The Georgia State University transportation study is instructive here not only for what it found the program could accomplish, but for the logistical barriers it documented. Even well-designed food support programs hit a ceiling when participants cannot get to distribution points. The intervention and the structural constraint operate in the same space.
A 2025 systematic review in Quality of Life Research identified education and income as the most important social determinants affecting health-related quality of life for people with chronic diseases. That finding has a direct implication: health interventions that target only clinical factors will hit a ceiling, because the determinants with the strongest effect on quality of life sit outside the clinical system entirely.
Remote patient monitoring and technology-enabled chronic disease management can extend reach into communities where transportation barriers and provider shortages limit in-person access. The honest caveat is that these tools require device access, reliable connectivity, and sufficient health literacy to function. Deployed without attention to those prerequisites, they can inadvertently widen the gap they are meant to close.
The thread running through all of this is consistent. Interventions exist, some show genuine promise, and the evidence base is growing. But that same evidence base keeps arriving at the same structural conclusion: reducing chronic disease in low-income communities requires acting on the conditions that produce it, not only on the conditions that result from it. Cross-sector coordination across health, housing, food, and transportation systems is not optional given that evidence; it is the logical implication of it. The financing and delivery structures that currently govern American healthcare are poorly designed for that kind of coordination. That is the gap the data keeps pointing toward, and it is worth being honest about how large it is.