Health Equity Metrics Used by Public Health Departments
Public health departments are finally tracking disparities, but lack consensus on what to measure.

Public health departments have spent decades promising to measure what matters. The uncomfortable truth, which anyone who has worked inside these systems long enough eventually confronts, is that the infrastructure for doing so has been assembled piecemeal, under pressure, and often in response to crises that revealed how much was missing. COVID-19 was the most recent and most brutal demonstration of that pattern. When disproportionate death rates among Black, Latino, and Native American communities became impossible to ignore, the field discovered that the data systems meant to detect such disparities were themselves incomplete. That experience did not create the push toward rigorous health equity measurement; it accelerated one that was already underway, and it exposed the gap between what departments claimed to track and what they could actually demonstrate.
The working definition matters here. The CDC and NACCHO have framed health equity as any identifiable effort or action whose purpose is to advance a fair and just opportunity for people to attain their highest level of health. That framing is deliberately broad, which creates a measurement problem: equity itself is not directly observable. What gets measured instead are health disparities, the gaps between population groups defined by race, ethnicity, income, geography, and other factors. The gap functions as a proxy. This conceptual move, treating disparity reduction as evidence of equity progress, shapes every metric choice a department makes downstream. But what if the prior definitional question — what "less inequitable" would look like in a given jurisdiction — is skipped entirely? That is precisely what happens in much of the field, and the skipping of it is where most of the inconsistency originates.
The Infrastructure Behind Local Health Department Measurement
Nearly 3,000 local health departments operate across the United States, each responsible for a defined set of public health services in their jurisdiction. The variation among them is enormous: some serve urban populations in the millions with substantial analytic staff; others serve rural counties with a handful of employees and no dedicated data infrastructure. Any honest accounting of health equity measurement has to hold that variation in view, because the metrics and tools discussed in policy documents are not uniformly available or uniformly implemented.
The Public Health Accreditation Board provides the most widely adopted structural scaffold. PHAB's accreditation standards are built on the 10 Essential Public Health Services, and equity sits explicitly at the center of all ten. The 2026 Accreditation Standards include 61 measures for initial accreditation and 32 Foundational Capability measures for Pathways Recognition. What makes accreditation operationally significant is not the credential itself but the behavior it produces: roughly 80 percent of health departments accredited for at least one year report applying health equity considerations to internal planning, policies, or processes. Accreditation functions as an adoption mechanism.
Federal funding reinforces that mechanism through a different lever. Grantees receiving federal public health funds face increasing requirements to report on health disparity measures, disaggregated by race and ethnicity. CDC's approximately $2.25 billion initiative awarded in mid-2021 under OT21-2103 built local health department capacity specifically around COVID-19 health disparity tracking. That investment represented a major inflection point, injecting both resources and accountability requirements into departments that had neither.
The field is still building, not consolidating. In 2023, NACCHO funded the Center for Public Health Systems at the University of Minnesota to help local health departments define, measure, and track health equity. That funding signal is worth pausing on: a national association funding a research center to help its own member organizations understand what they should be measuring is an acknowledgment that the playbook is not yet settled.
Health Outcome Disparities: The Core of What Gets Tracked
Outcome disparity metrics are where most measurement effort concentrates. These indicators compare mortality rates, life expectancy, and disease prevalence across population groups, providing the empirical evidence that a disparity exists and quantifying its magnitude. The distribution of what actually gets tracked reveals something about where the field's capacity and confidence lie.
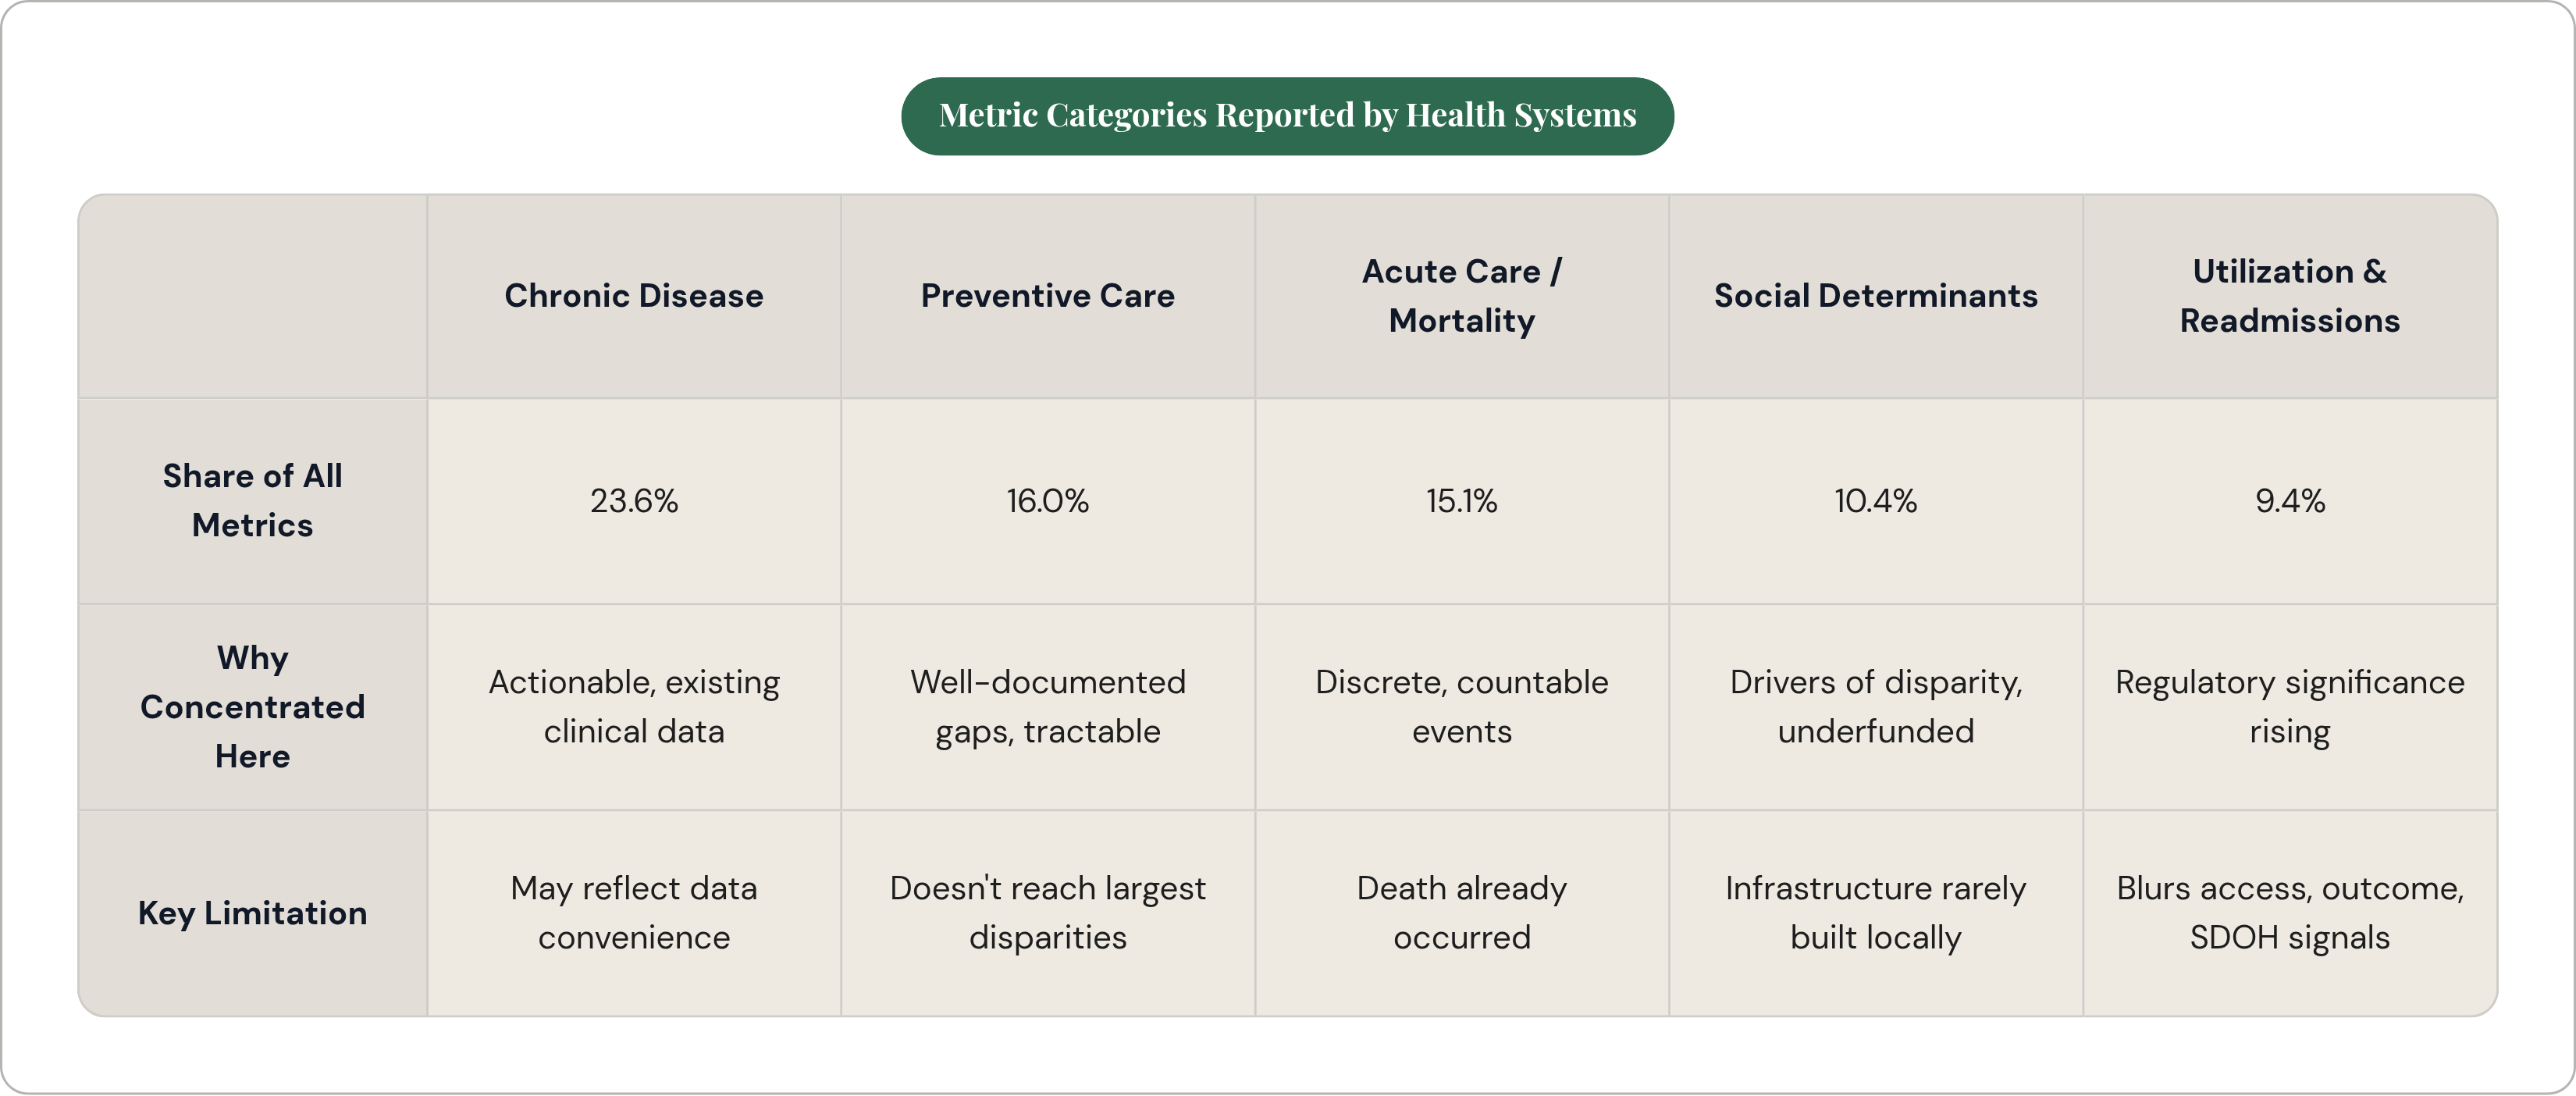
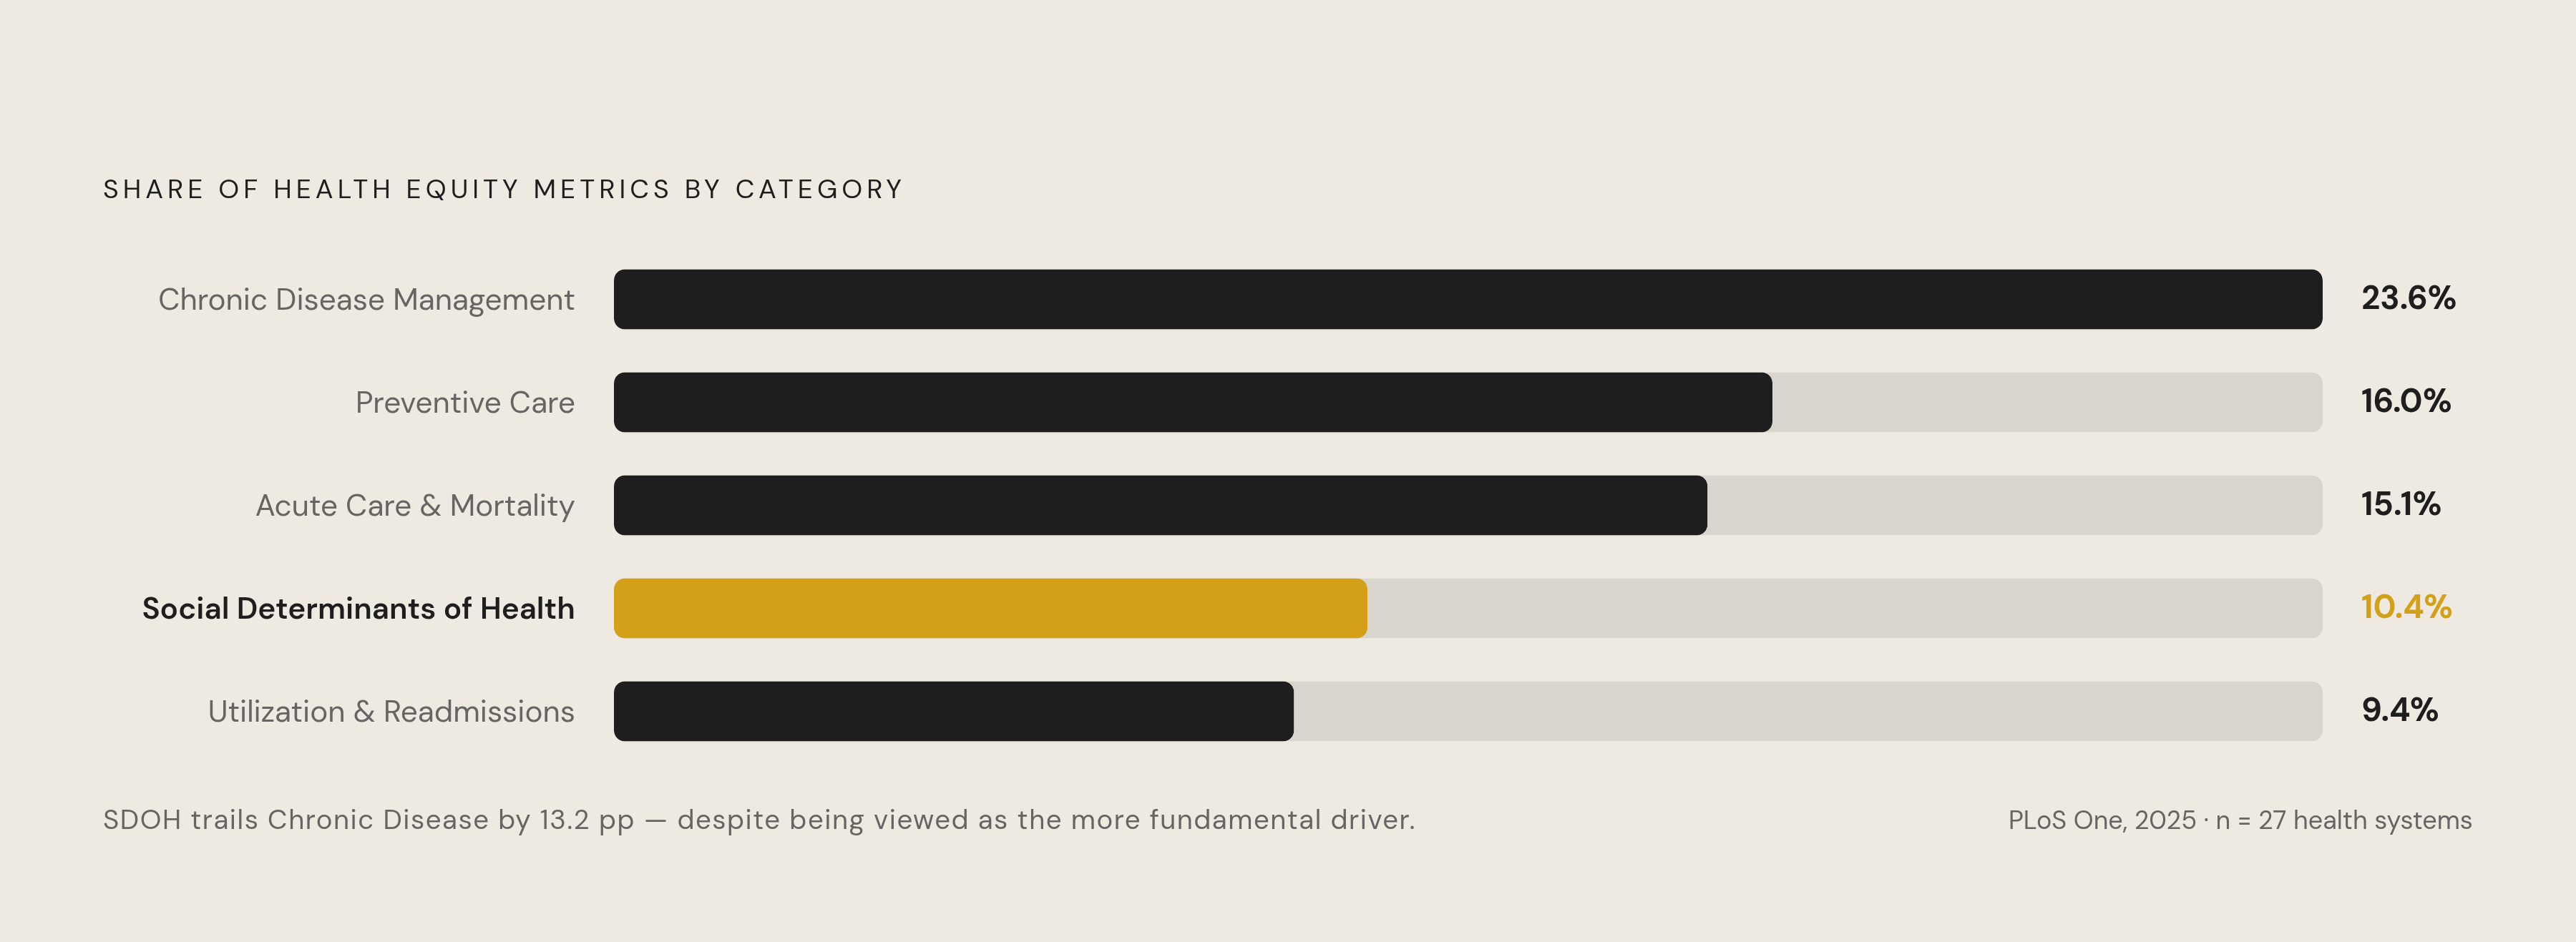
A 2025 study published in PLoS One, drawing on survey data from 27 health systems, found that chronic disease management was the most frequently reported metric category, accounting for 23.6 percent of all metrics mentioned. Within that category, diabetes and blood pressure and hypertension control were the most commonly cited focus areas. Preventive care metrics followed at 16.0 percent, covering cancer screenings, mental health screenings, well child visits, and immunizations. Acute care metrics, including mortality across multiple causes, represented 15.1 percent.
The clustering around chronic disease and prevention is not accidental. These are conditions where disparity is well-documented and where intervention is at least theoretically tractable; you can redesign a diabetes management program more readily than you can redesign a neighborhood. Mortality and acute care metrics are easier to count because the events are discrete and reportable, but they are harder to act on. A death has already occurred. Chronic disease metrics require sustained data infrastructure, but they sit closer to the point where intervention changes outcomes.
It is also worth considering whether that distribution reflects genuine strategic priority or something more contingent. Departments may be gravitating toward chronic disease metrics not only because they are actionable but also because the data infrastructure for them already exists in clinical settings. That convenience shapes what gets measured in ways that don't always align with where the largest disparities live.
Social Determinants Indicators: Measuring What Drives the Outcomes
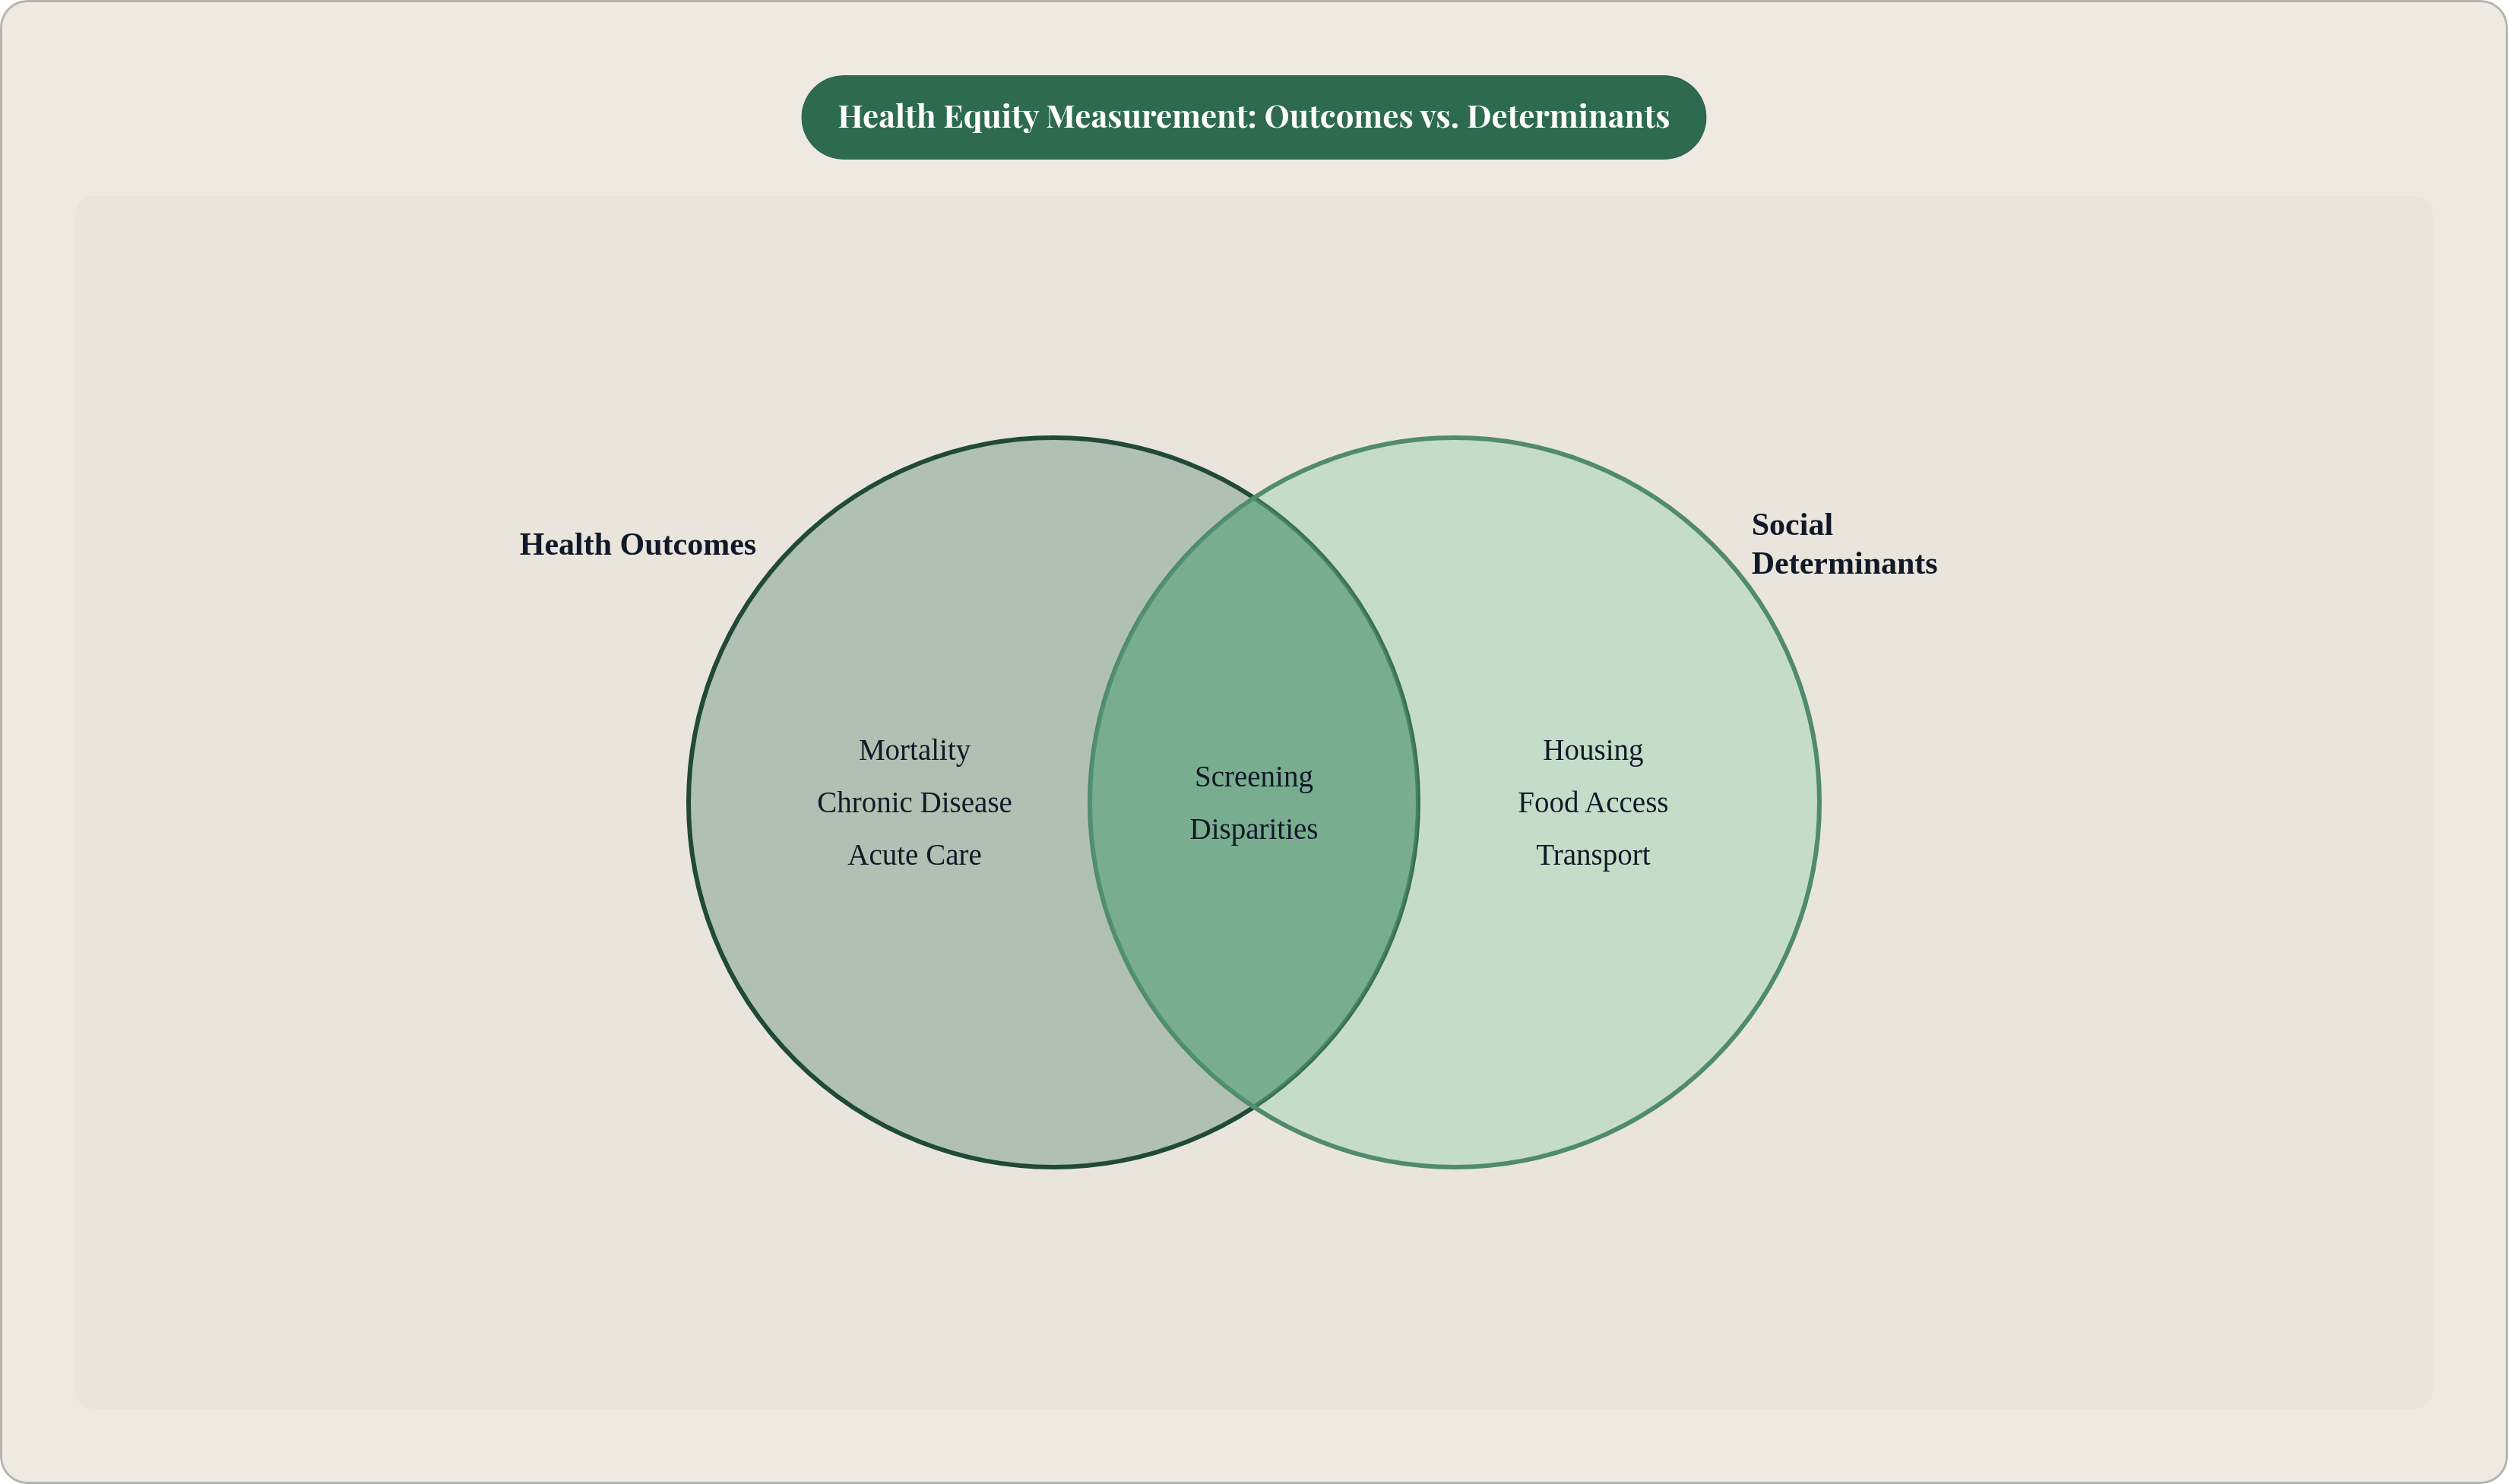
If outcome disparities are the signal, social determinants are the mechanism. Housing instability, food insecurity, transportation barriers, employment precarity, and exposure to structural racism do not merely correlate with worse health outcomes; they produce them through well-documented pathways. Measuring social determinants is therefore not supplementary to equity measurement; it is, in many frameworks, the more fundamental act.
The data from the field tells a more complicated story. In the same PLoS One survey, social determinants of health metrics accounted for only 10.4 percent of all metrics reported, a notably smaller share than outcome metrics. That gap reflects where data infrastructure has and has not been built, not where practitioners believe the drivers of disparity are located.
CMS has designated five specific social needs for mandatory screening: food insecurity, housing instability, transportation needs, utility difficulties, and interpersonal safety. These five categories provide a minimum floor for what clinical systems are expected to capture. CDC's Behavioral Risk Factor Surveillance System added a Social Determinants and Health Equity module in 2022, and the data from that module documented significant racial and ethnic differences in social and emotional support, employment instability, food insecurity, housing insecurity, and utility and transportation instability. Elevated prevalences of adverse social determinants were found among American Indian and Alaska Native, Black, Native Hawaiian and Other Pacific Islander, multiracial, and Hispanic adults compared with White adults. The BRFSS module gives departments a surveillance vehicle for these comparisons at scale, which matters enormously for smaller departments without independent survey capacity.
CDC's PLACES tool extends that capacity further, providing modeled estimates for all U.S. counties, places, ZIP Code Tabulation Areas, and census tracts across 36 chronic disease measures, including social determinants indicators. For a rural health department with three staff members, PLACES is not a supplementary resource; it is the primary data source. The practical implication is that national tools are filling gaps that local infrastructure cannot close, which concentrates analytical dependence on federal systems and introduces its own vulnerabilities.
Healthcare Access and Quality Metrics as a Bridge Between Systems and Communities
Access and quality indicators occupy a conceptually interesting position in the equity measurement landscape. They sit between structural conditions and health outcomes, measuring differences in whether people can reach care, what quality they receive when they do, and how the system responds when they engage with it. At the local level, common starting points include immunization rates disaggregated by zip code, preventable hospitalizations stratified by income level, and cancer screening rates broken down by race and ethnicity.
Geographic granularity is what gives these metrics their accountability function. An aggregate immunization rate for a county tells you something. The same rate disaggregated to the census tract level tells you where the system is failing and, crucially, makes that failure visible to decision-makers who might otherwise not see it. The transformation from a system-level statistic to a community-level accountability tool depends entirely on the willingness to disaggregate and publish.
Utilization and readmissions metrics represented 9.4 percent of metrics in the PLoS One survey. That share understates their regulatory significance. The Joint Commission's 2024 National Patient Safety Goal held health systems accountable for health care equity performance for the first time, folding access and quality metrics into a compliance landscape. Equity measurement is no longer solely a quality improvement exercise; for accredited health systems, it carries regulatory weight.
There is an analytic complication worth acknowledging. A high rate of preventable hospitalizations in a low-income zip code is simultaneously an access metric, an outcome metric, and a social determinants signal. The categories that appear distinct in frameworks blur together when applied to real communities. That overlap is not a problem to be solved by cleaner taxonomy; it reflects the actual structure of health inequity, where causes and consequences compound across domains. Composite tools exist precisely because single-domain metrics cannot capture that compounding.
Demographic Stratification: The Analytic Layer That Makes All Other Metrics Work
A mortality rate is not an equity metric until it is disaggregated. Stratification by race, ethnicity, income, geography, sex, age, and other social categories is what transforms population health data into evidence of disparity. Without it, a department can report on health outcomes; it cannot report on equity.
Race and ethnicity is the most commonly used demographic filter for evaluating equity across health systems, per the PLoS One survey. In that study's sample of 27 health systems, all collected race and ethnicity data, all captured it through self-report at patient registration, and 77.8 percent also collected it through a patient-facing online portal. The uniformity of collection method matters: self-report is considered more accurate than observer assignment, but it introduces its own forms of measurement error, particularly for populations with complex or multiracial identities.
Standard stratification domains extend well beyond race and ethnicity. Sex, sexual orientation and gender identity, age, socioeconomic status across its education, income, wealth, and occupational dimensions, country of birth, disability status, and geographic location all appear in current frameworks. The National Committee for Quality Assurance expanded race and ethnicity stratification to nine additional HEDIS measures in measurement year 2024, reaching 22 stratified measures in total. As of measurement year 2026, NCQA requires reporting on the Middle Eastern or North African category, aligned with updated Office of Management and Budget guidelines. The stratification categories themselves are not static; they are subject to ongoing revision as demographic understanding and data collection capabilities evolve.
The data quality problem undercuts all of this. COVID-19 made visible what researchers had documented for years: national data collection systems for race and ethnicity were incomplete, inconsistent across jurisdictions, and structured in ways that obscured rather than illuminated disparity. The measurement system depended on data that did not fully exist. Later infrastructure investments were framed, at least in part, as responses to that exposure. But how does this affect our original promise to measure what matters? Improving demographic data quality is a slow, resource-intensive process that requires changes in clinical workflows, patient trust, and data governance simultaneously — and until that foundation is solid, every metric built on top of it carries uncertainty.
Composite Health Equity Indices and Dashboards as Synthesis Tools
A department tracking chronic disease outcomes, SDOH indicators, access and quality metrics, and demographic stratification across multiple population groups is generating a volume of data that resists synthesis at the level of individual indicators. Composite tools exist to address that problem, combining multiple indicators into a single score or structured display that allows decision-makers to assess equity performance across domains without processing every underlying metric.
The Health Equity Index is one such tool, measuring disparities across race, ethnicity, income, education, and other factors within domains spanning access to care, preventive services, chronic disease management, and social determinants. The composite structure trades granularity for legibility, a tradeoff that has real consequences for how findings are acted upon.
In the PLoS One survey, 81.5 percent of health systems monitored equity metrics through a system-level or enterprise-level dashboard, often described as a health equity scorecard. Dashboards have become the dominant operational format. Their prevalence reflects a governance reality: executive-level visibility into equity performance changes how equity work is resourced. A metric that surfaces in a leadership dashboard is more likely to generate organizational response than the same metric buried in a program report.
A counterintuitive finding from that same survey deserves attention. Systems at later stages of equity measurement implementation were tracking fewer metrics, not more. That raises an important question: does measuring more actually serve equity goals, or does it diffuse accountability? That pattern suggests maturation involves narrowing toward what is actionable rather than expanding coverage indefinitely. Departments that have worked through the process of defining, collecting, and acting on equity metrics tend to consolidate around a smaller set of high-signal indicators. The early-stage impulse to measure everything yields, through hard experience, to the recognition that metrics only matter if someone can act on them.
The limitation of composite indices is the obverse of their advantage. A single composite score can tell you that a disparity exists and roughly where it ranks relative to prior periods; it cannot tell you which domain is driving the composite downward. Departments need the composite view for communication and accountability, and the disaggregated data underneath it for diagnosis and intervention.
Frameworks and Toolkits That Guide Metric Selection in Practice
The practical question for a local health department beginning or formalizing equity measurement is not which metrics exist in the literature; it is which metrics this department can collect, interpret, and act on given its current capacity. Several frameworks have been developed to bridge that gap between the theoretical menu and operational reality.
The UMN/CPHS Health Equity Performance Measures Toolkit, funded by NACCHO and released in 2024, covers defining and measuring health equity over time, data disaggregation for racial and ethnic groups, community partnership building, and practice examples. Its organizational readiness self-assessment asks LHD staff to rate six focus areas on a four-point scale, from not yet started to embedded. That framing treats metric adoption as a maturity continuum rather than a binary state, which is more honest about where most departments actually are.
CDC's updated Program Evaluation Framework, revised in 2024, made its most substantial change by adding three cross-cutting actions to every step in the evaluation process: engage collaboratively, advance equity, and learn from and use insights. The revision embeds equity into the evaluation process itself, not solely into the metrics that process generates. That structural move matters because a department can select the right equity metrics and still produce findings that are never used to change practice, if the evaluation process does not build in learning and accountability at each stage.
The Institute for Healthcare Improvement published a framework in October 2025 developed with a Health Equity Accelerator of 19 health care organizations, offering a four-step approach to identifying, quantifying, tracking, and reporting disparity data. The IHI framework is positioned as a candidate industry standard, which reflects a genuine gap: despite the proliferation of toolkits, no single authoritative framework governs metric selection across health departments nationally.
CDC's Health Equity Indicators for Cardiovascular Disease Toolkit demonstrates how disease-specific equity measurement gets operationalized. It provides a conceptual framework, a comprehensive indicator list, measurement guidance, data source guidance, and implementation examples. The domain-specific structure is a model for other disease areas, and its existence signals that generic equity frameworks are being supplemented by more targeted operational tools.
The multiplicity of frameworks is itself informative. A field with one authoritative standard is a field that has resolved its foundational debates. The coexistence of competing toolkits reflects active standardization, which means flexibility for early adopters and inconsistency for the field as a whole.
Where Implementation Actually Stands and What Holds It Back
The gap between what health equity measurement looks like in policy documents and what it looks like inside most local health departments is substantial. The PLoS One survey found that roughly a quarter of the 27 health systems studied were still in the planning phase of equity measurement implementation, approximately a third were in early implementation, and roughly another quarter had practices in place for only one to two years. Few had deeply embedded equity measurement as a routine organizational function.
The UMN/CPHS toolkit finding sharpens that picture further: only a small number of public health plans had actually incorporated health equity interventions or tracked progress toward equity goals. Having metrics is not the same as using them to drive action. That gap, between data collection and organizational change, is where most of the practical challenge lies.
Data infrastructure remains a binding constraint. COVID-19 demonstrated that national data collection was not representative, particularly for race and ethnicity, and that local departments had been building measurement systems on an incomplete foundation. Data siloing compounds the problem. Gaps in data governance create barriers to sharing between local health departments, state agencies, and health care systems. Without clear data-sharing rights and interoperability standards, assembling the complete picture needed for equity analysis requires negotiations that many departments lack the capacity or authority to conduct.
California's Hospital Equity Measures Reporting Program, administered through the Department of Health Care Access and Information, requires hospitals to collect, analyze, and publicly publish health equity data annually beginning in September 2025. State-level mandates like this represent one mechanism for moving past voluntary adoption when toolkit availability and technical assistance alone prove insufficient. Regulatory pressure has historically been a significant driver of data infrastructure investment, and the California example will be watched by other states.
The implementation picture that emerges from the available evidence is not discouraging so much as clarifying. Regulatory pressure is necessary but not sufficient. Toolkits are useful but not self-executing. Organizational readiness, analytic capacity, and data governance are the binding constraints, and they are not primarily technical problems. They are organizational and political ones. Departments that have made the most progress tend to be those where equity measurement is connected to resource decisions, where leadership visibility into disparity data is routine, and where the question "what would we do differently if we knew this?" is asked before a metric is selected. That last question, deceptively simple, is the one the field is still learning to answer consistently.