Healthy People 2030 Goals and Measurable Targets
Federal targets show where the U.S. health system must improve and why data beats intentions.

Healthy People 2030 is the federal government's fifth attempt, since 1980, at building a national health framework that answers to actual numbers instead of good intentions. It pairs broad goals with 358 core objectives and specific, data-driven targets, and it does this at a moment when the U.S. spends more of its GDP on health care than any other developed nation and still trails its OECD peers on life expectancy, infant mortality, and obesity. That gap is the whole reason the thing exists. I've spent enough time inside this framework, pulling apart its tiers and squinting at its target math, to think the only honest way to judge it is to trace how it runs from vision down to benchmark, so that's what this piece does.
The five overarching goals and what they actually cover
HHS launched Healthy People 2030 in August 2020, with the Office of Disease Prevention and Health Promotion running point, and every decade since 1980 has produced a new edition shaped by whatever science and public health priorities were current at the time. The vision statement itself is plain enough: all people should be able to reach their full potential for health and well-being across their entire life span. Five goals sit under that vision, and none of them is filler.
The first goal covers healthy, thriving lives free of preventable disease, disability, injury, and premature death, which is what you'd expect from any health initiative worth its name. The second is where it gets interesting: eliminating health disparities, achieving health equity, and reaching health literacy, named as its own goal rather than folded into the first. The third calls for social, physical, and economic environments that support health. The fourth focuses on healthy development and behavior across every life stage. The fifth asks for engaged leadership, across sectors, in shaping policies that promote health.
Notice the framework widens from "health" to "health and well-being." That's not a nicer word choice for its own sake; it's a structural decision that resurfaces later, when well-being gets its own measures sitting right alongside the traditional health outcomes. Paired with the second goal, this tells you something about intent. Health equity and social determinants aren't footnotes stapled onto a clinical document here; they're the load-bearing goals that everything downstream leans on, including objectives that reach into education, employment, and housing. The five goals stay broad on purpose, though. Accountability lives a layer below, which is where things get harder to fake.
How the three tiers of objectives divide the work
Goals inspire. Objectives measure. HP2030 splits its objectives into three tiers, and the gaps between them tell you something honest about what can actually be tracked right now versus what people wish could be tracked.
Core objectives carry the weight, all 358 of them, each with a 10-year target and each tied to an intervention backed by real evidence. These are the ones with enough data behind them to set a target and actually check progress against it. Developmental objectives sit one rung down: high-priority issues where an evidence-based intervention already exists, but a reliable baseline doesn't, not yet anyway. Rather than fake a target without solid footing under it, HP2030 flags these as placeholders, an admission that measurement has to wait on data collection catching up to ambition. Research objectives go further still. Forty were added at launch, covering ground where even the evidence base itself is still forming.
Making the core list isn't automatic, either. An objective has to clear three bars: national importance (real burden, wide reach), strength of evidence, and an explicit check on whether it affects health disparities. HP2030 also runs stricter data rules than HP2020 did. Baseline data can't be older than 2015, it has to be nationally representative, its variability has to be known, and the objective needs a reasonable shot at picking up at least two more data points before the decade closes out.
Worth saying plainly: HP2030 has fewer total objectives than HP2020 did. That's on purpose, a deliberate trade. Fewer objectives, each held to a tougher evidentiary bar, is the bet the framework makes. Whether that bet buys clarity or just narrows the picture is a fair question. I keep coming back to it every time I look at the progress numbers.
The 8 Overall Health and Well-Being Measures that frame everything else
Above the objectives sit 8 Overall Health and Well-Being Measures, or OHMs, which take in the HP2030 vision at the widest possible altitude. These grew out of what HP2020 called "Foundation Health Measures," and the update adds a well-being measure, concrete proof that the conceptual shift named in the goals wasn't just language on a page somewhere.
Examples include life expectancy at birth overall, life expectancy free of activity limitation, life expectancy free of disability, life expectancy in good or better health, and respondent-assessed health status of good or better. Targets are what's missing from that list; OHMs don't have them. They're monitoring tools, not scoreboards, and the difference matters. A core objective gets met or missed, full stop. An OHM just gets watched, the backdrop against which everything else gets read.
Take the well-being numbers from 2021. A large majority of U.S. adults reported life satisfaction of "satisfied" or "very satisfied." Fine, until you break it apart by group. Among people with disabilities, that figure fell to a notably lower share, against a much higher rate for people without disabilities. A 17-point gap sitting quietly under a 95% headline is exactly why a well-being measure without disaggregation hides more than it shows. It's a small preview of a theme that runs through the whole framework: aggregate numbers can look fine while real disparity sits underneath, unseen, and HP2030's equity goal only means anything if the data gets sliced fine enough to catch it.
How the 23 Leading Health Indicators focus national effort
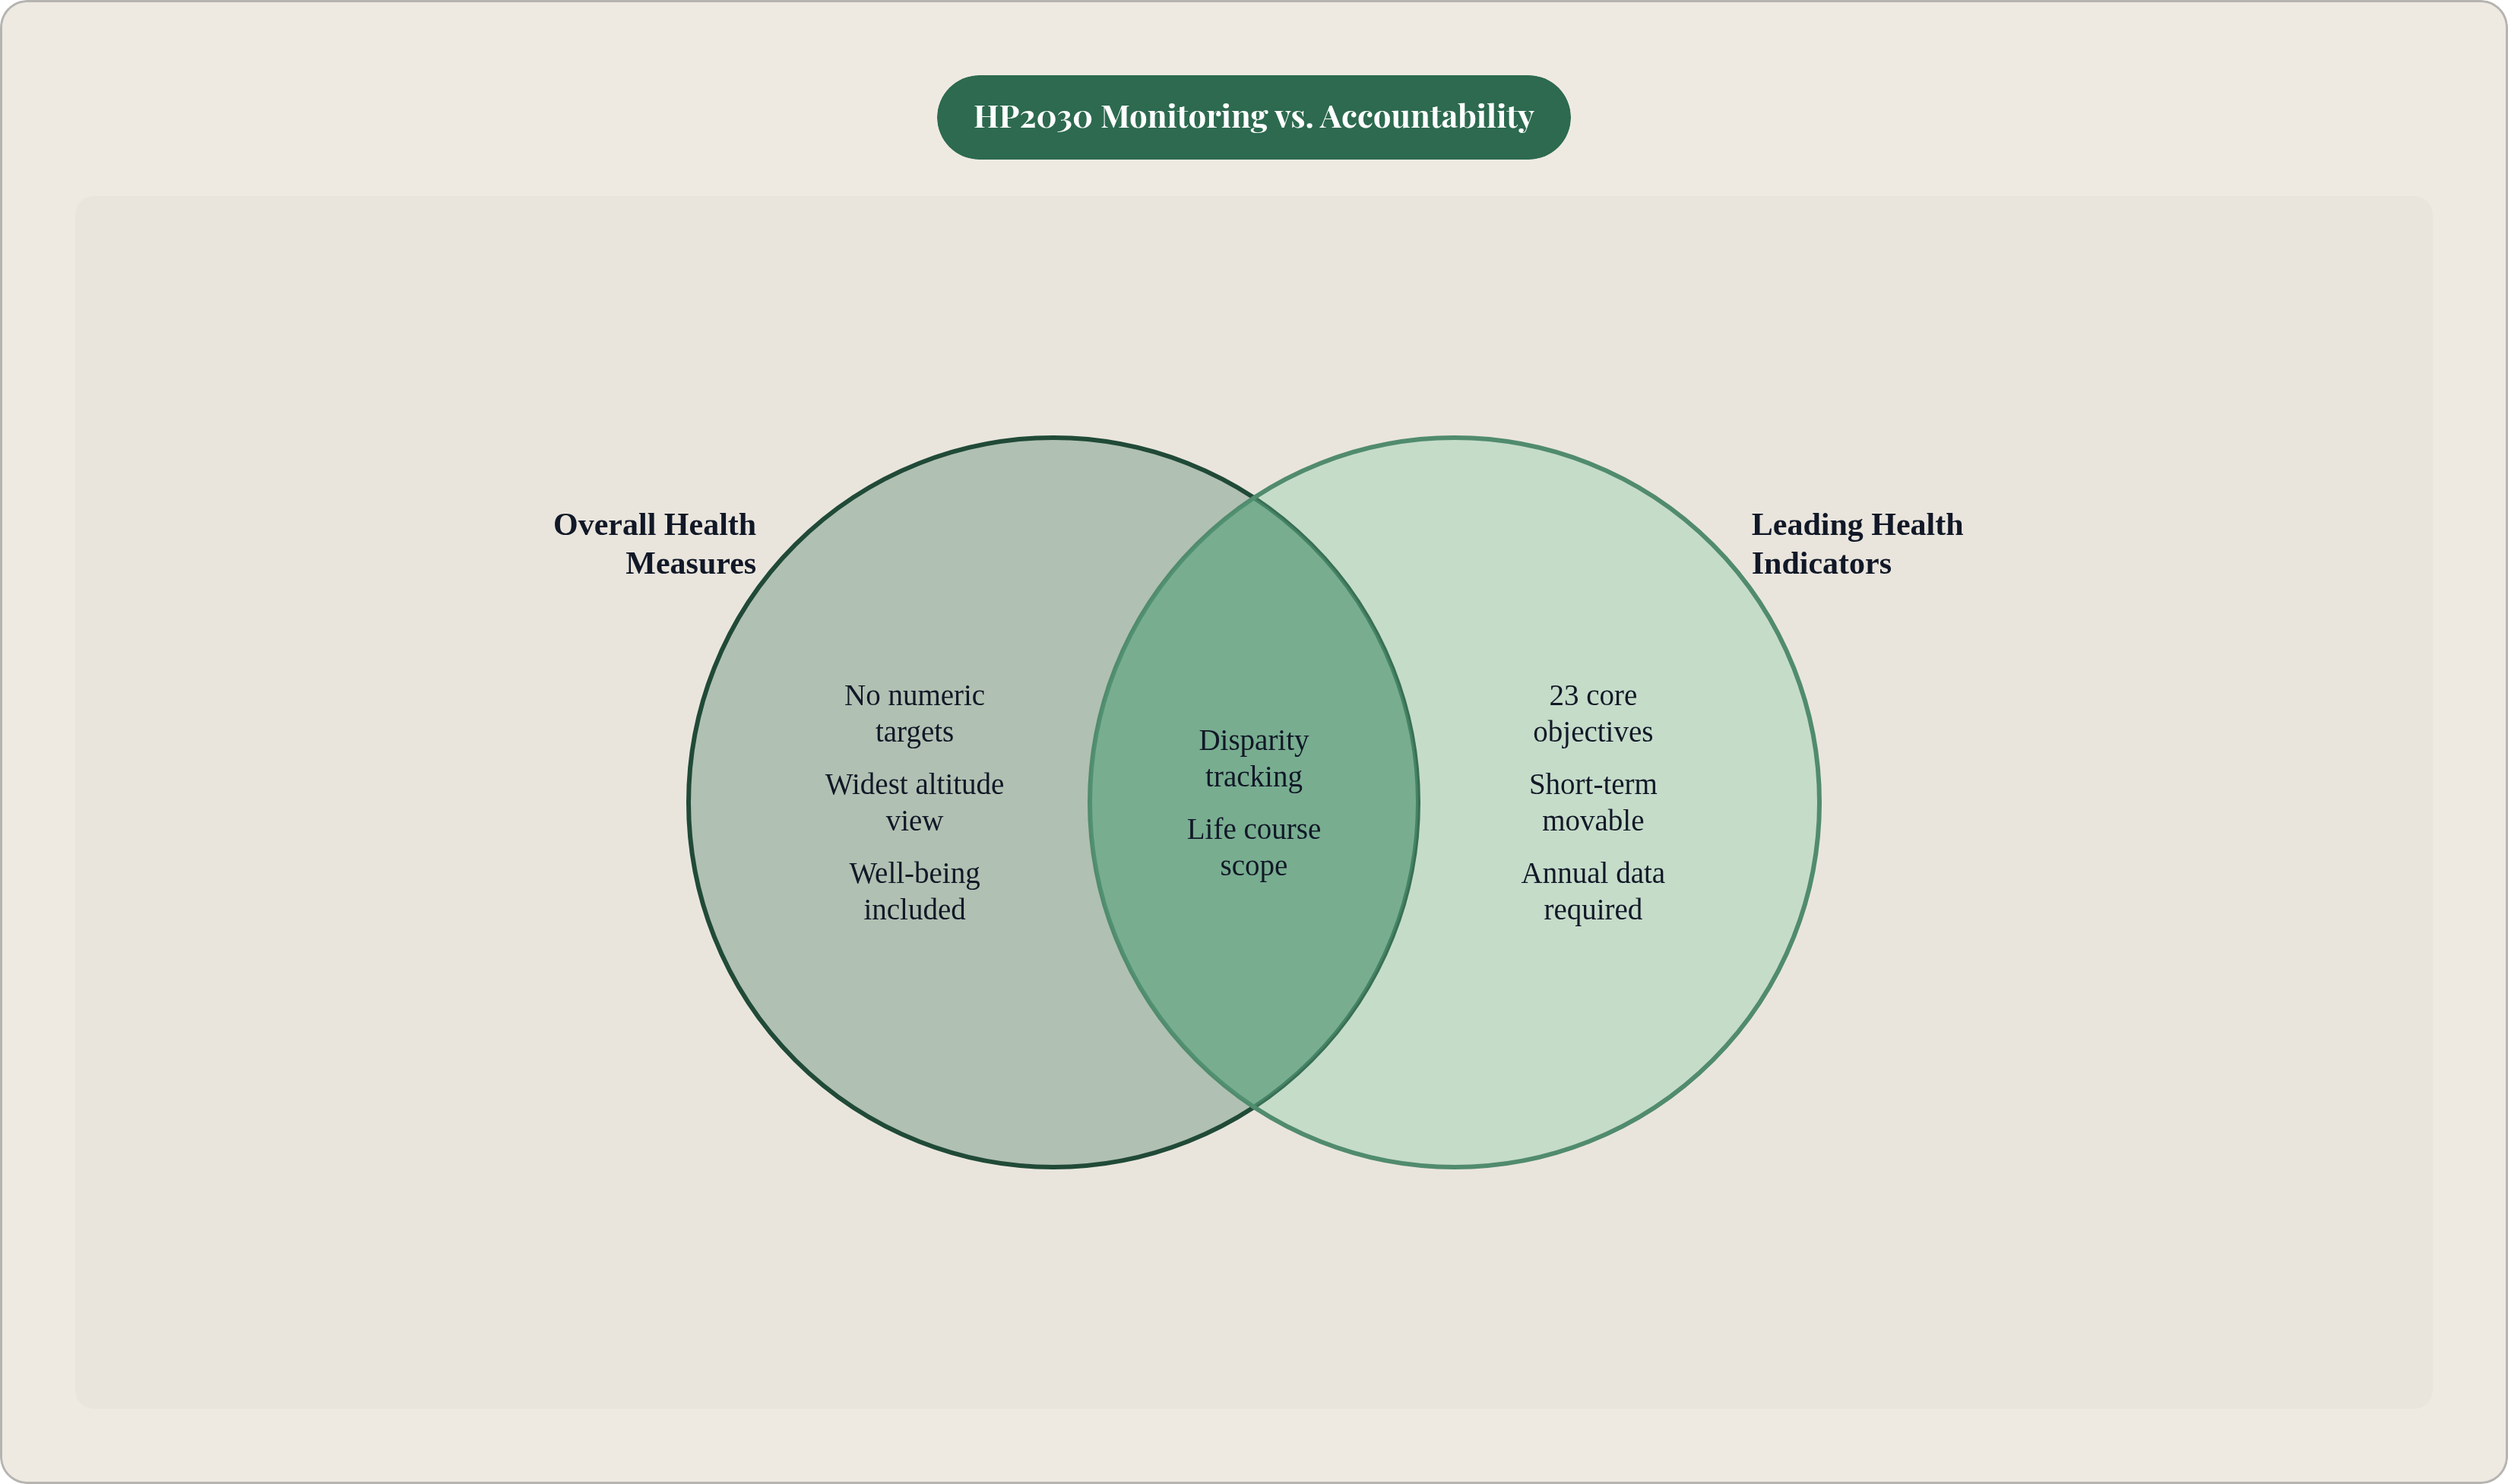
If OHMs are the wide shot, the 23 Leading Health Indicators are the zoom-in. LHIs are a hand-picked subset of the core objectives, chosen to drive action rather than just describe what's happening. Three things put an objective on this list: it has to be movable in the short term through evidence-based work, it has to touch social determinants or disparities, and it has to throw off new data close to once a year.
The list runs the full life course. Early childhood reading proficiency is on it. So is adult hypertension control, and so is the drug-overdose death rate. Clinical outcomes sit right next to social determinants like employment and food insecurity, and that placement isn't accidental. It says something about what the framework thinks causes what.
A few indicators are worth knowing by their actual codes, since they come up again later. AHS-01 tracks the share of people with health insurance. SDOH-02 tracks employment among working-age adults. NWS-04 covers childhood and adolescent obesity. IVP-09 is the homicide rate. Adolescent depression treatment, binge drinking, and colorectal cancer screening round out the list. These 23 are the public face of HP2030; when a policymaker or a reporter wants to know if the country's getting healthier, this is the list they pull up. The logic behind the selection, what counts as a lever versus what counts as a lagging number, ends up shaping the entire public conversation about the nation's health.
How targets are set and what the tracking categories mean
Targets aren't guesses pulled from thin air. NCHS built statistical tools specifically for target-setting, and the numbers that come out reflect a blend of data, expert input, public health policy, and agency priorities. That process produces two different ways of measuring progress, and mixing them up is one of the easiest ways to misread what's actually happening on the ground.
The first is percentage of targeted change achieved, or PTCA: how far the country has moved toward a target, expressed as a share of the total ground that needed covering. The second is percentage change from baseline, or PCB: the raw, directional move from where an indicator started, regardless of how far off the target sits. An objective can post a positive PCB and still show a weak PTCA if the target set for it was ambitious to begin with. It works the other way too, and I've seen this exact confusion trip up otherwise careful readers of Healthy People progress reports.
Every objective, over the decade, lands in one of five tracking categories: baseline only, target met or exceeded, improving, little or no detectable change, or getting worse. NCHS pulls data for all of this from more than 80 sources, and roughly half of the core objectives run through NCHS's own data systems directly. The other half lean on outside sources. That second half is exactly where the framework starts to feel fragile, a point the closing section digs into.
Where U.S. progress stands on the Leading Health Indicators as of 2025
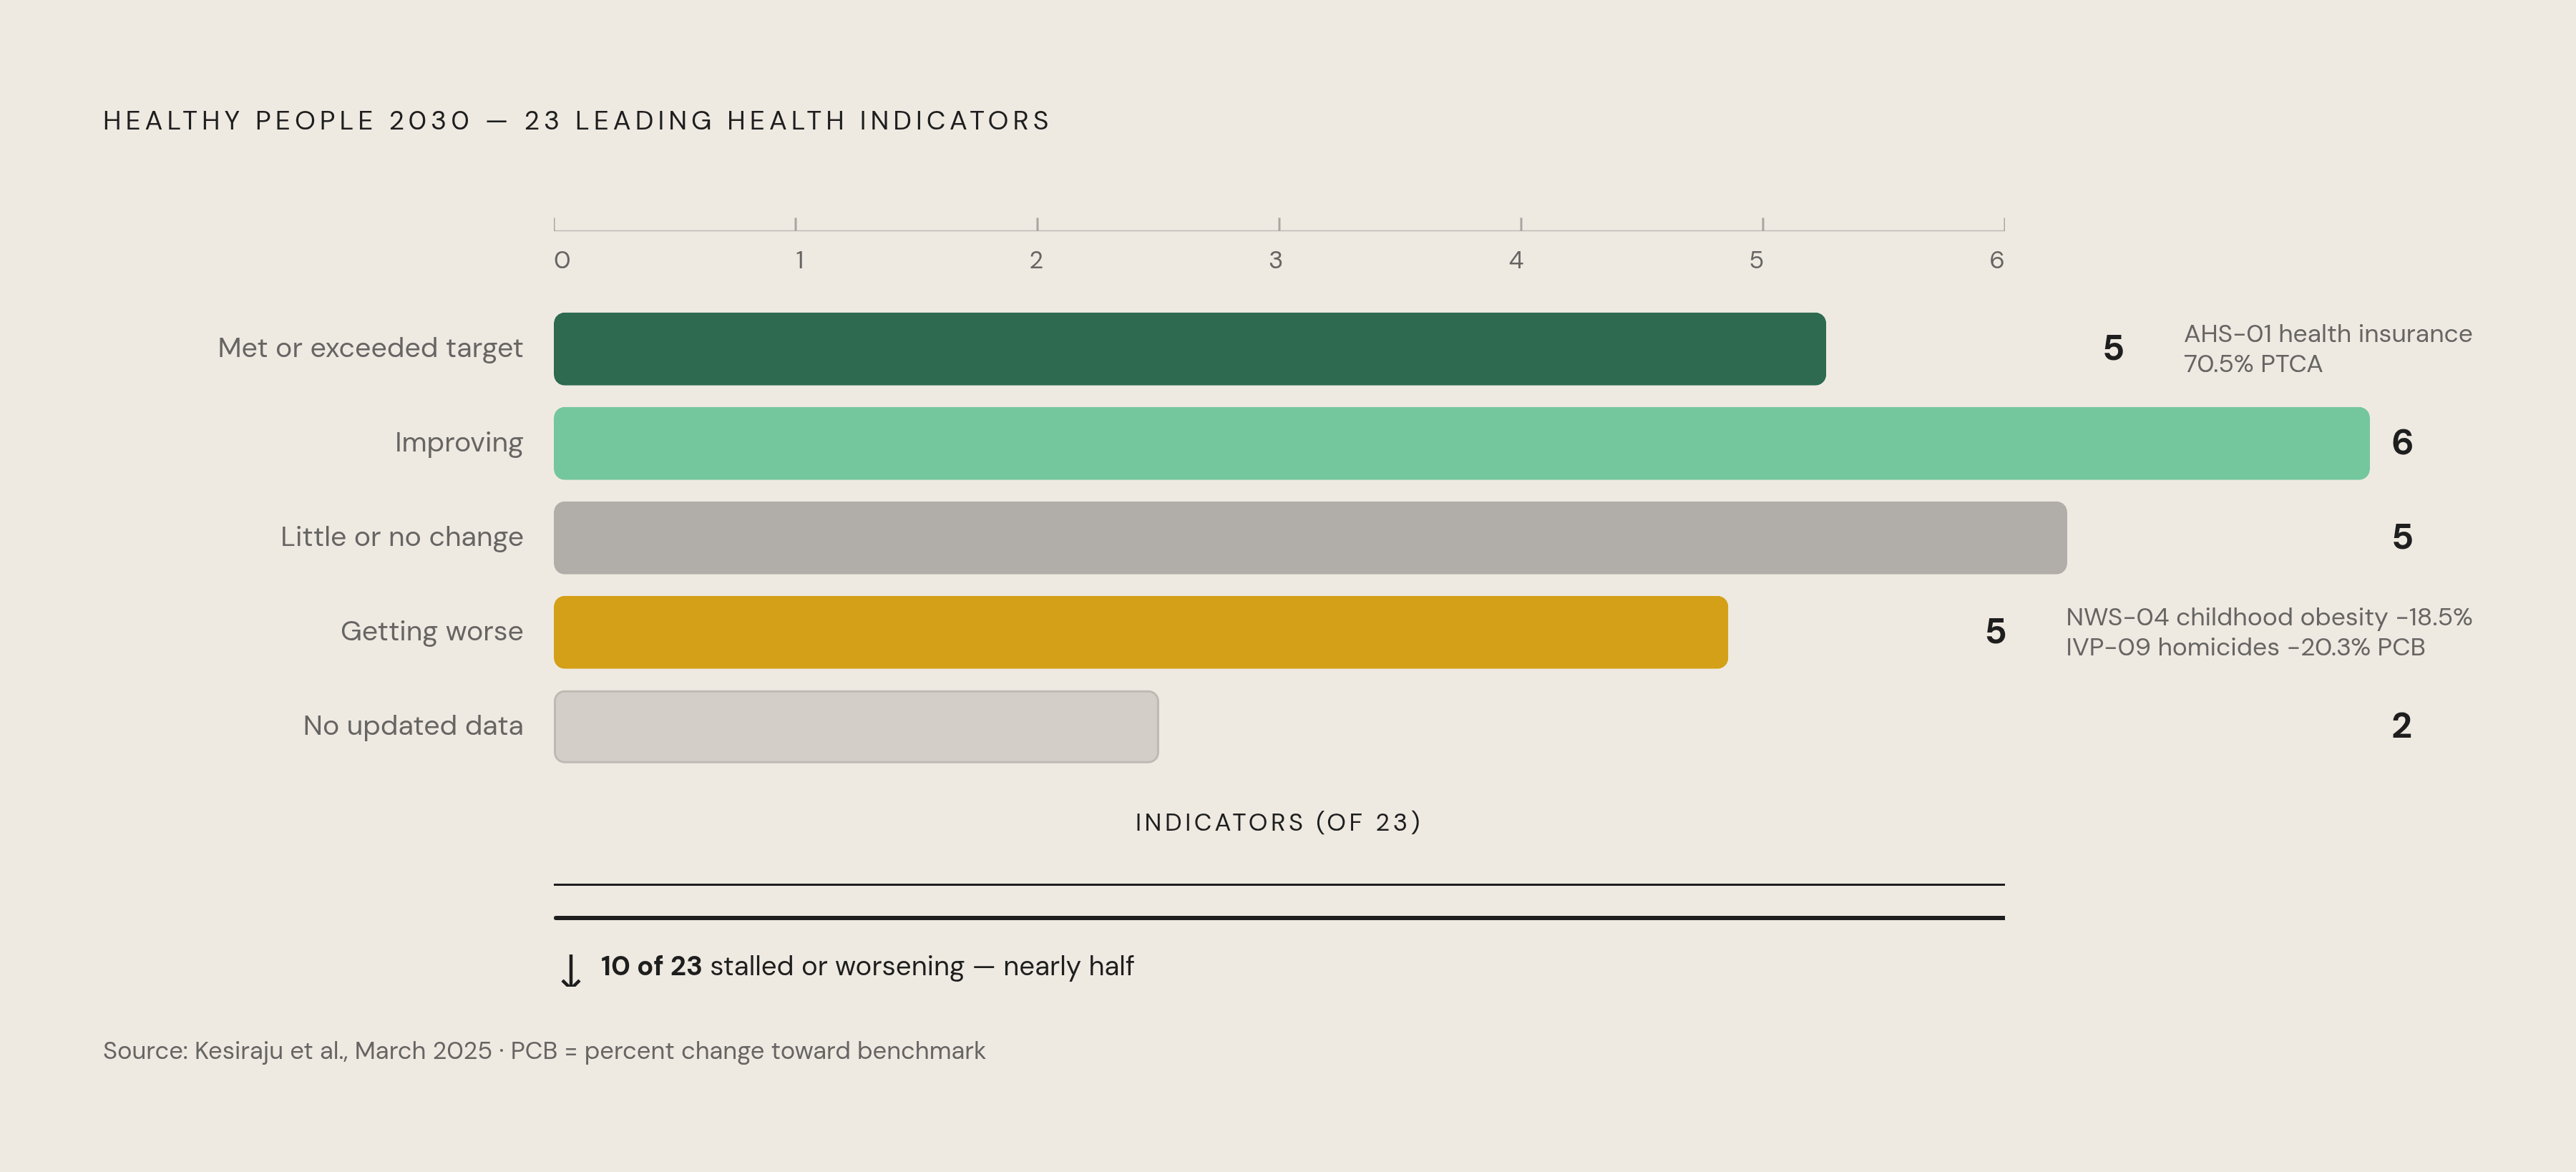
The most complete recent look comes from Kesiraju et al., published in Health Affairs Scholar in March 2025, and the picture is mixed, at best, depending on which slice you're staring at.
Of the 23 LHIs, 5 have met or beaten their targets. Another 6 are improving. Five show little or no detectable change. Five are getting worse. Two don't have an updated value yet. Add it up and 10 of 23, nearly half, are either stalled or sliding backward. That's not a framework collapsing, but it's not one cruising toward success either. It's a country making real headway on some fronts while losing ground on others, often the ones that matter most to the people living through them.
The bright spots earn their mention. AHS-01, health insurance coverage, posted a PCB of 3.5% and a PTCA of 70.5%, one of the strongest showings on the whole list. SDOH-02, employment, came in with a PCB of 1.3% and a PTCA of 20.5%: positive, but plenty of runway left. Adolescent depression treatment, binge drinking reduction, and hypertension control are all trending up too.
The worsening indicators are harder to sit with, honestly. NWS-04, childhood and adolescent obesity, posted a PCB of negative 18.5%, a sharp slide the wrong way. IVP-09, homicides, came in at negative 20.3%. Drug-overdose deaths and food insecurity are also worsening. In the little-or-no-change bucket, NWS-10, added sugar consumption, moved just 2.2%, and IID-09, flu vaccination, actually dropped 2.1%. Then there's D-01, yearly diabetes diagnoses, and C-07, colorectal cancer screening, both stuck at baseline only with no updated figure to report. That's the developmental-objective problem playing out in real time. You can't track what you haven't measured yet.
Why the SDOH objectives represent a structural departure from prior editions
For the first time in the history of this framework, social determinants of health objectives carry 10-year targets. Earlier editions acknowledged that housing, education, and income shape health outcomes; HP2030 holds those same factors to the identical accountability standard as blood pressure control or cancer screening rates. That's the departure, and it's a bigger one than it sounds.
The SDOH content splits into five place-based domains: economic stability, education access and quality, health care access and quality, neighborhood and built environment, and social and community context. It isn't boxed off in one corner of the document, either. It runs through other topic areas across the whole framework, and you see this play out directly in the LHI list, where employment and food insecurity sit right next to hypertension and obesity. That's a deliberate statement that these things cause each other rather than living in separate categories on separate spreadsheets.
For a policymaker, this changes what "improving an SDOH indicator" actually means. It stops being a soft, feel-good add-on. It's tracked with the same PTCA and PCB math as any clinical objective, so progress or failure shows up in the data whether anyone wants it to or not. That raises an uncomfortable test case right now: NWS-01, food insecurity, is already flagged as worsening. In September 2025, USDA announced it would cancel future surveys measuring household food insecurity, a data collection effort running since the 1990s. If that survey disappears, NWS-01 doesn't just stall. It becomes untrackable, full stop, and the entire SDOH ambition of HP2030 turns out to rest on data infrastructure that isn't guaranteed to still be standing next year.
Health equity and health literacy as embedded design principles, not add-ons
One of the five overarching goals is explicitly about eliminating health disparities and reaching health equity. It's not a sub-topic buried inside another goal. It's structural, and it shows up in how objectives even qualify for the core list; recall the three selection criteria from earlier, national importance, strength of evidence, and disparity impact. That third criterion means an objective's bearing on equity can decide whether it makes the cut at all.
Health literacy got its own overhaul too, the first update to the definition in roughly two decades. HP2030 splits it into personal health literacy, an individual's ability to find, understand, and use health information, and organizational health literacy, how well institutions make that information usable in the first place. Both matter, and pulling them apart makes the concept something you can actually act on instead of a vague aspiration written into a mission statement. The scale of the problem deserves a real number: around 36% of adult Americans scored at or below the basic level of health literacy, per the National Assessment for Adult Literacy. HP2030 treats that baseline as something that can move, not as a fixed fact about the population it's stuck describing forever.
But what happens when the equity goal and the actual progress data pull in opposite directions? Kesiraju et al. (2025) found that inequalities have persisted or widened for most LHIs, and the indicators most likely to be worsening, suicides, homicides, food insecurity, drug-overdose deaths, are disproportionately concentrated in populations that were already disadvantaged before the framework ever launched. That's a real tension, not a footnote to smooth over and move past. HP2030 is also more explicit than earlier editions about naming structural racism and systemic bias as social determinants that shape health literacy and drive disparities. Saying it plainly counts as progress of a kind, though whether the data moves in response is a separate question, and right now the honest answer is: not enough.
Data infrastructure threats that put future tracking at risk
Everything covered in this piece, the goals, the three-tiered objectives, the OHMs, the LHIs, the PTCA and PCB math, depends on more than 80 data sources staying intact, current, and broken down by group. That dependency is the framework's quiet weak point, and heading into 2026, it's being tested for real.
Recent actions include pulling federal data off public websites, deleting sociodemographic variables (race and ethnicity in particular, along with sexual orientation and gender identity), and delaying releases that used to come out on a fixed schedule. A KFF review of publicly available federal datasets through August 2025 found these changes concentrated specifically on stripping race, ethnicity, and SOGI variables. Those aren't minor fields buried in a spreadsheet somewhere. They're the exact variables needed to track health disparities, which is itself a core HP2030 objective, not a side interest tacked onto the framework for optics.
The food insecurity survey cancellation mentioned above fits this same pattern exactly. A measurement program running since the 1990s, gone; NWS-01 was already flagged as worsening before that decision even landed. Developmental objectives sit especially exposed here. If data collection gets disrupted before a baseline is even set, those objectives may never become trackable at all, stuck permanently in the placeholder category HP2030 built for issues still waiting on evidence to catch up.
So what does this actually mean going forward? HP2030's whole claim to transparency depends on data that stays consistent, disaggregated, and nationally representative, year after year, without interruption. Pulling sociodemographic variables doesn't just make disparities harder to see; it makes the equity goal structurally impossible to measure. The PTCA and PCB metrics that give this framework its meaning need a continuous, comparable data stream to run on. Break that stream, and the accountability chain the whole initiative was built on breaks along with it, quietly, in a way that won't show up as a headline until years from now when someone tries to pull a baseline that was never set.